Table of Contents
Click to quickly access specific sections
- Reports
- Filters
- Schedule History
- Recordings
- Schedules
- Download Reports
- Billing Usage Report
- Blocked Calls Report
- Call Back Report
- Caller Activity Report
- Call Logs Report
- Call Logs Extended Report
- Conversation Overview Report
- Conversations by Region Report
- Conversation Trends Report
- Group Insights Report
- IVR Keypress Report
- Manager Insights Report
- Analytics Summary Report
- Marketing Dashboard Report
- Tags Summary Report
- Tracking Number Settings Report
- User Logs Report
- Webhook Logs Report
- Call Logs with Data Append Report
- Agent Insights Report
- Survey Report
- Scored Calls Report
- Spam Guard Report
- SMS logs Report
Reports
Convirza offers all the reports mentioned below. Click on the drop-down menu to see all available reports.

Here is the list of default Reports, which will be available for all customers.
|
Report Name |
Description |
|
Analytics Summary |
Know what happened during phone conversations with all our call indicators and Conversation Analytics services |
|
Call Back |
See unanswered calls and Missed Opportunity calls. Call back the strong lead and save the opportunity. |
|
Caller Activity |
Summarizes all calls placed by individual Caller IDs and, if available, caller ID lookup information. |
|
Call Logs |
Call summary information, call trends over time, and limited individual call detail records. |
|
Call Logs Extended |
Extended reports of call logs provide full call details for download and scheduling. There are 3 subreports 1. Call Logs - Detailed Info - Call Logs - CA Indicators Data 2. Call Logs - Call Scores - Additional Info of custom sources and data append |
|
Conversations by Region |
Target your best markets and help the weaker areas with a dynamic heat map. Instantly see where callers are located. |
|
Conversation Trends |
Conversations aggregated by day and by hour are displayed side by side for quick comparison and staffing. |
|
Group Insights |
Know the segregation of Conversations for every group |
|
Marketing Dashboard |
Quickly see which ads are working and which are not in this two-part report. Performance is tracked for all marketing and digital marketing. |
|
Marketing Dashboard Extended |
Provides more information about marketing performance |
|
Scored Calls |
Provide insight into the overall performance based on the agents, calls scored, reviewed, and highest scores based on groups, users, etc. |
|
Tags Summary |
Shows all your call tags and which tags are used most often. Spot new insights and weaknesses. |
|
Agent Insights |
Know how your agents are performing |
|
Conversations Overview |
Provides visual representation for all |
|
Survey Report |
Know the responses for the Agent and Caller Survey on this report |
|
Tracking Number Settings |
See every campaign and every tracking number. Audit all your tracking number settings. |
|
Tracking Number Settings Extended |
See more detailed information about the tracking numbers |
|
Billing Usage |
Supplements your monthly invoice with details of all users, numbers, minutes, and analyzed calls. |
|
Manager Insights |
Know how the Agents/Team is performing |
|
Blocked Calls |
The Blocked Calls Report displays the details of caller ids that have been blacklisted in the system. It also contains details of those calls and caller IDs blocked by the spam guard. |
|
User Logs |
Every user activity logged in the CFA application is displayed in the User Logs Report. |
|
Webhook Logs |
A full listing of each Webhook trigger and the results of each, plus complete details to manage every Webhook. |
Here is the user's permission to access the particular report. Reports accessibility depends on the reports added to the account and which reports the logged-in user can access. If the user can access a specific report, they can permit other users access to those reports.
|
Report Name |
Admin |
Standard |
Read-Only |
Identified Only |
Scorer |
|
Analytics Summary |
✅ |
✅ |
✅ |
✅ |
✅ |
|
Call Back |
✅ |
✅ |
✅ |
✅ |
✅ |
|
Caller Activity |
✅ |
✅ |
✅ |
✅ |
✅ |
|
Call Logs |
✅ |
✅ |
✅ |
✅ |
✅ |
|
Call Logs Extended |
✅ |
✅ |
✅ |
✅ |
✅ |
|
Conversations by Region |
✅ |
✅ |
✅ |
✅ |
✅ |
|
Conversation Trends |
✅ |
✅ |
✅ |
✅ |
✅ |
|
Group Insights |
✅ |
✅ |
✅ |
✅ |
✅ |
|
Marketing Dashboard |
✅ |
✅ |
✅ |
✅ |
✅ |
|
Marketing Dashboard Extended |
✅ |
✅ |
✅ |
✅ |
✅ |
|
Scored Calls |
✅ |
✅ |
✅ |
✅ |
✅ |
|
Tags Summary |
✅ |
✅ |
✅ |
✅ |
✅ |
|
Agent Insights |
✅ |
✅ |
✅ |
✅ |
✅ |
|
Conversations Overview |
✅ |
✅ |
✅ |
✅ |
✅ |
|
Survey Report |
✅ |
✅ |
✅ |
✅ |
✅ |
|
Tracking Number Settings |
✅ |
❌ |
❌ |
❌ |
✅ |
|
Tracking Number Settings Extended |
✅ |
❌ |
❌ |
❌ |
✅ |
|
Billing Usage |
✅ |
❌ |
❌ |
❌ |
✅ |
|
Manager Insights |
✅ |
❌ |
❌ |
❌ |
✅ |
|
Blocked Calls |
✅ |
❌ |
❌ |
❌ |
✅ |
|
User Logs |
✅ |
❌ |
❌ |
❌ |
✅ |
|
Webhook Logs |
✅ |
❌ |
❌ |
❌ |
✅ |
Analytics Summary: Know what happens During phone conversations with all our call indicators and Conversation Analytics services
and
Scored Calls: The Scored Calls Report will provide insight into the overall performance based on the agents, calls scored, reviewed, and highest scores based on groups, users, etc. Will be available with a Scorecard subscription.
Both of these reports are related to the scorecards. These reports will be available when CA is turned on, or a Manual/Hybrid scorecard is available for the account.
Spam Guard, Call logs with data append, IVR Keypress, Survey Report will be available if the component for those functionalities is added to the subscription.
Filters

Using filters is essential to retrieve specific data. The filter’s option gives the user as many specifics so that you can sort the data.
When you need to add the filters click on the bold Filters icon in the left hand at the top of the report. A page will pop up with the filters to select from. Once the selected filters are updated, click the Refresh button on the window; if you do need to delete any selected filter, you can click on the cross in front of the selected filter or click on ‘Clear All’. All filters except the default filters will be removed. Click on ‘Refresh’ once again after the changes are made.
Drill-down functionality works for the filters. If you select a specific group as a filter, only the campaigns available for that filter will be available for the selection under the campaigns filter. The same applies to users, tracking numbers, and other filters. Different sets of filters are available for different reports. You must click the ‘Refresh’ button after any changes in the filters and time zones.
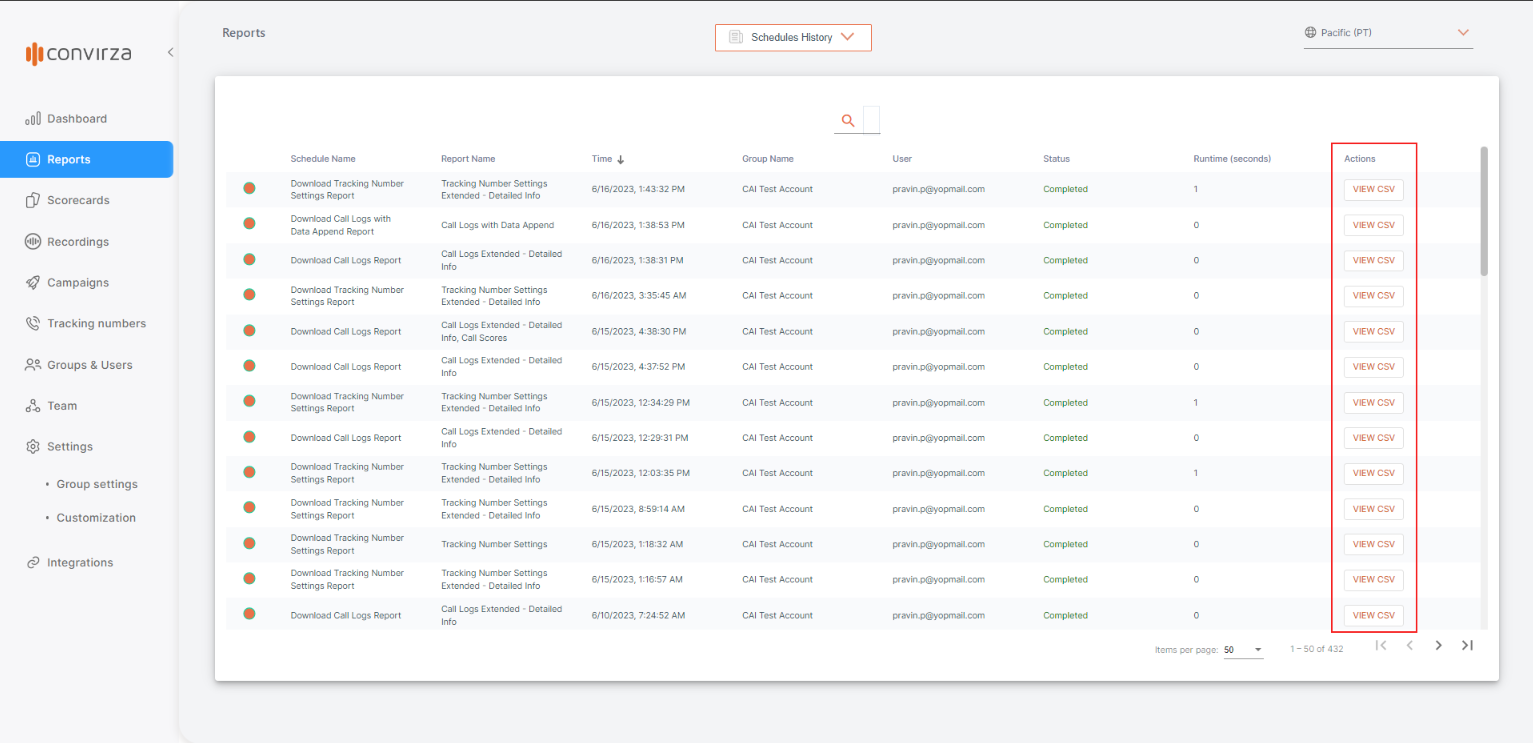
Schedule History
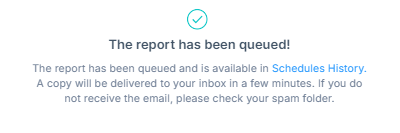
For every report, when the user clicks on the download and selects the report they would like to download, it gets queued up on the schedule history page, and the pop-up message is displayed as shown below. If you click on Schedule History on the pop-up message then you will be directed to the Schedule History page.

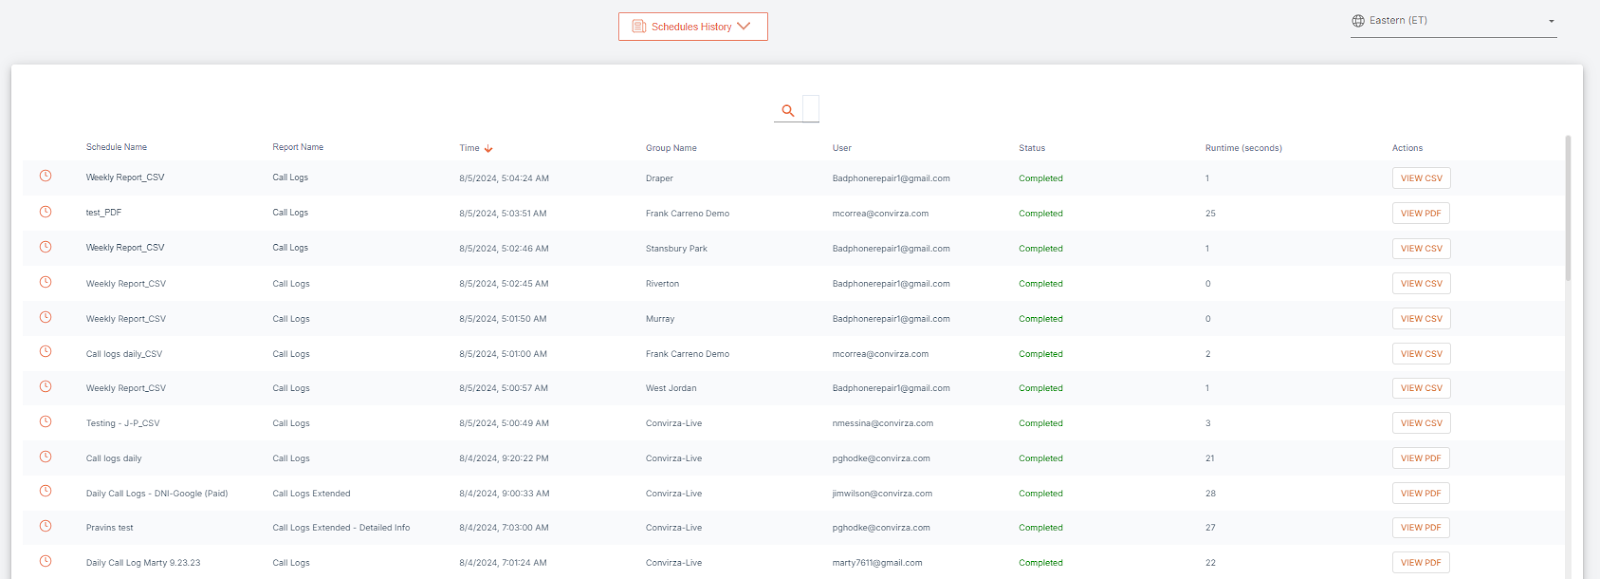
Denotes the report was scheduled.
Denotes the report was downloaded.
Save Filters and Reset to default
You can select a particular filter or combination of multiple filters and save the filters for future use. Once saved, the data will be shown as per the saved filters. Reset to Default will reset the filters to the default filters.
Recordings
Those users with access can listen to the recordings. In the reporting suite, data may be limited based on how many calls are in the filtered date range. To listen to the recordings, click on the Play Conversation icon in the ‘Action’ column available in the following reports:
- A) Call Logs Report
B) Call Back Report
C) IVR Keypress Report

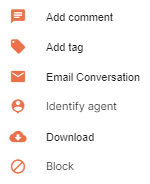
Action (...)
You can add comments, tag, Download, Email conversation, Identify agent, Download, and Block the caller from action (...) options.
Download Reports
There are a few different ways to download the data from each report. These options are displayed in the screenshot below. Users can select which report they want to download and whether it should be downloaded as CSV, PDF, or both. Users can also download the report with an option near the grid, as shown in the screenshot.
*NOTE* The reports can also be downloaded from the Scheduled History page.

Review call button allows you to review the call instantly. Clicking the review call button will direct the user to the conversation details page in a new tab.
Schedules
The user can schedule the report with this option. The reports will be delivered to the email address. When the user clicks on the Schedule, the following window with the list of scheduled reports pops up.![]()
Users can edit/Delete or add the new schedule from here. When the user clicks on New, the user can select the filters, frequency, recipients, etc., for scheduling new reports.


If the schedules have a single filter for Groups, Users, Tracking Numbers, or Campaigns added to the schedule and those are deleted, then the schedule gets deleted.
If the schedule is added with multiple filters for Groups, Users, Tracking Numbers, or Campaigns, and any one or two are deleted, then those filters gets removed from the schedule.
Following are the reports provided by Convirza with detailed information.
Billing Usage Report
The Billing Usage Report supplements your monthly invoices with details of all Users, Numbers, Minutes, Analyzed calls, etc. If the INCLUDE DELETED REPORTS option is selected, then the data is shown for the deleted groups.

This report shows Total calls, Uploaded calls, Total analyzed calls, Total analyzed minutes, Total tracking numbers, Total minutes, Total users (and active/inactive users), Total numbers, Reserved numbers, etc.
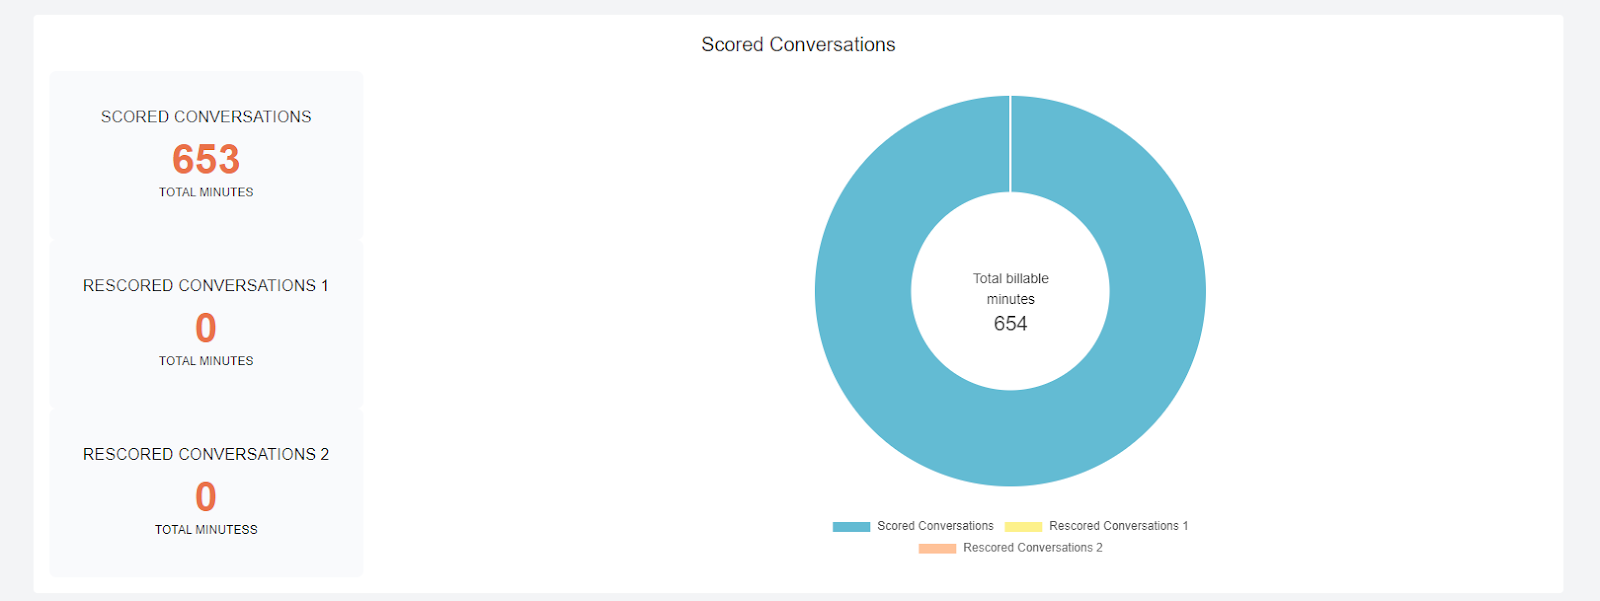
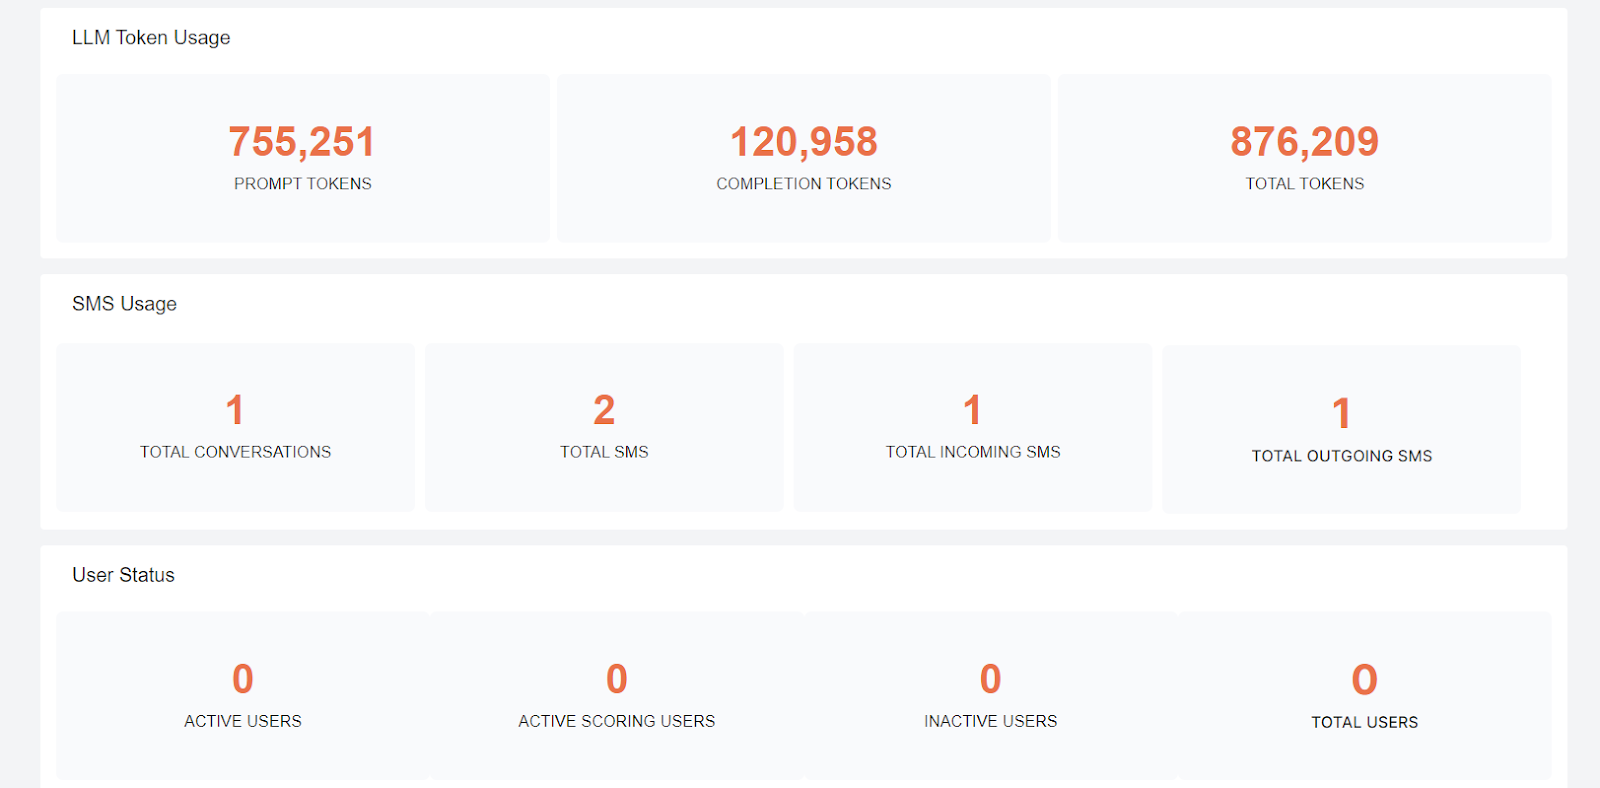
This report also includes information about scored conversations and other details for LLM tokens, SMS usage, Number information, User information, etc.
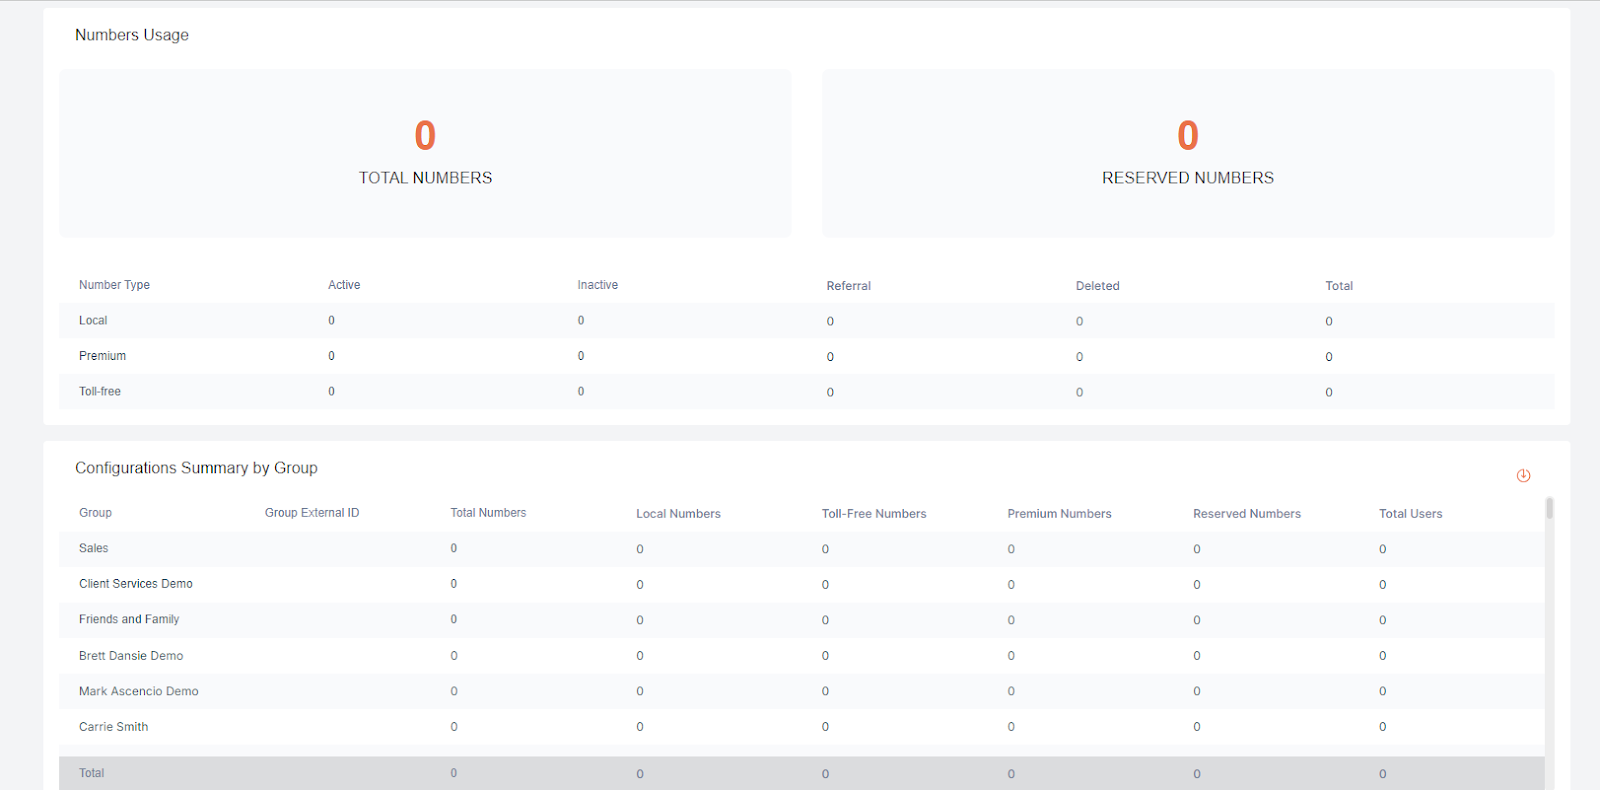
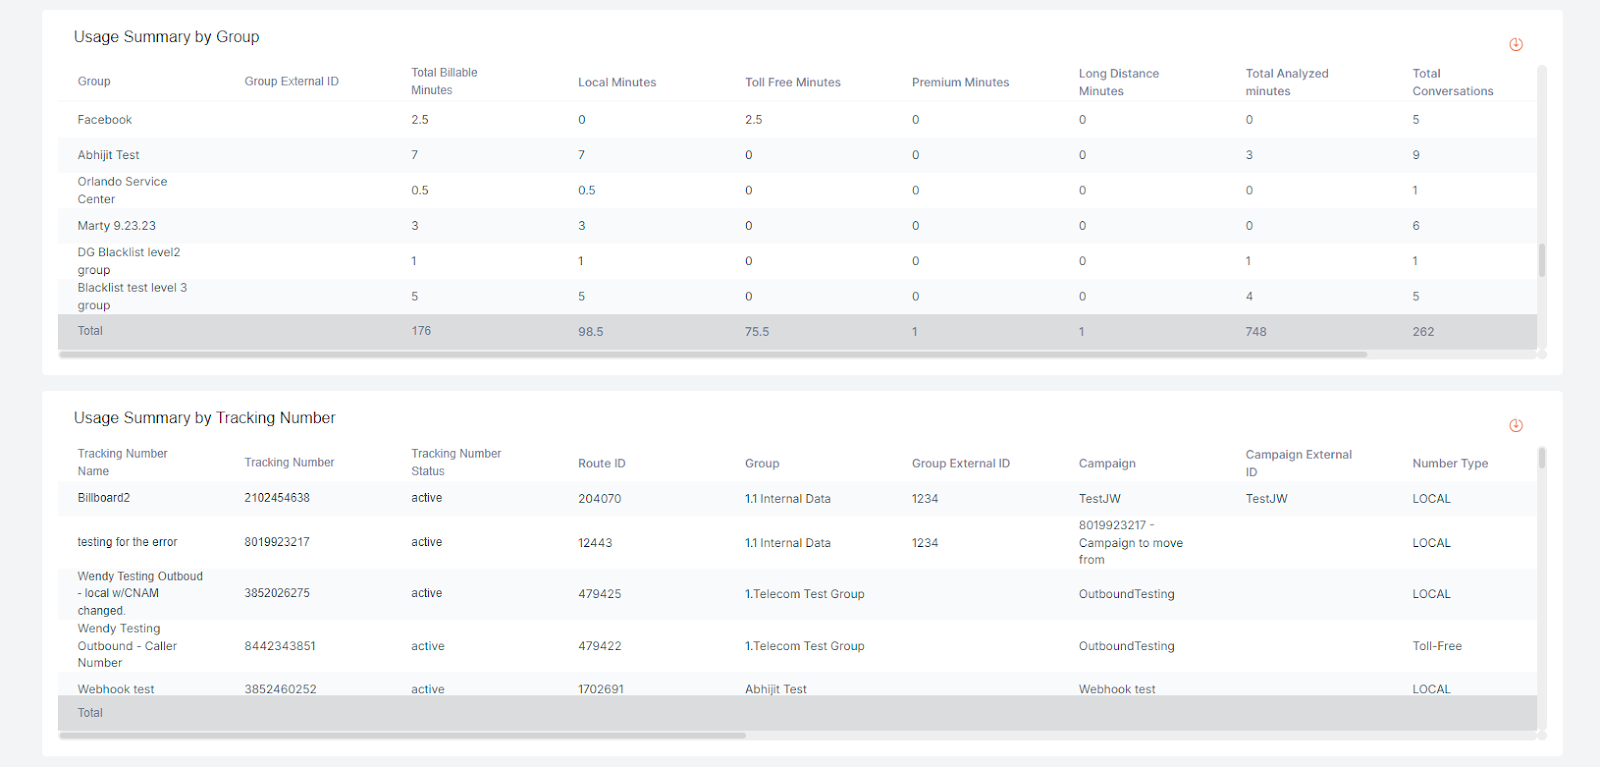
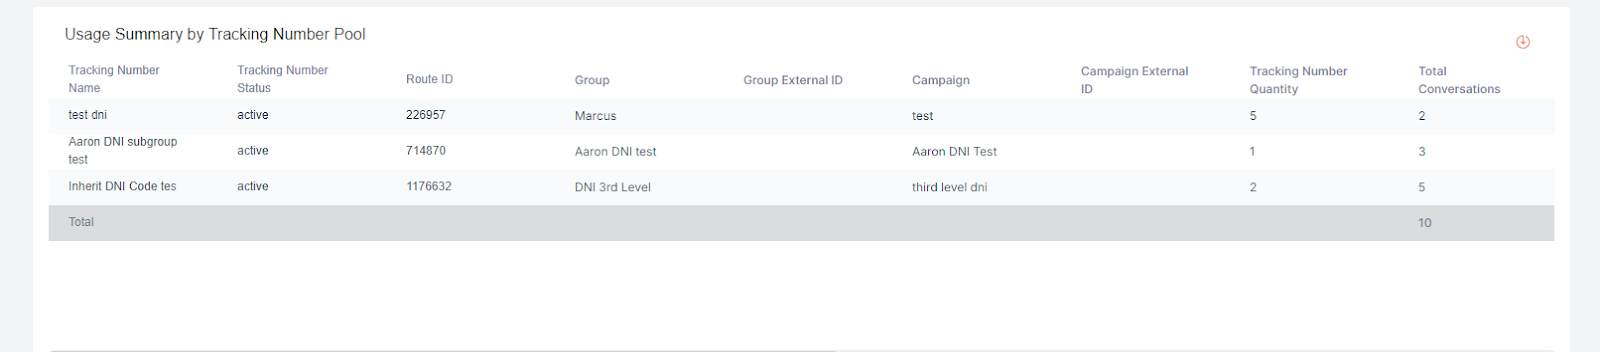
This report also shows data on Configuration Summary by Group, Usage Summary by Group, Tracking numbers and Tracking number pools.
Blocked Calls Report
The Blocked Calls report displays the details of the Caller IDs that have been blacklisted in the system. It also contains details of calls that were blocked by the system.

This report shows the number of calls checked and blocked. The grids in the report display information regarding Blocked numbers and Blocked calls.
Call Back Report
The Call Back report displays Unanswered calls and Missed Opportunity calls. Callbacks are strong leads and save opportunities.
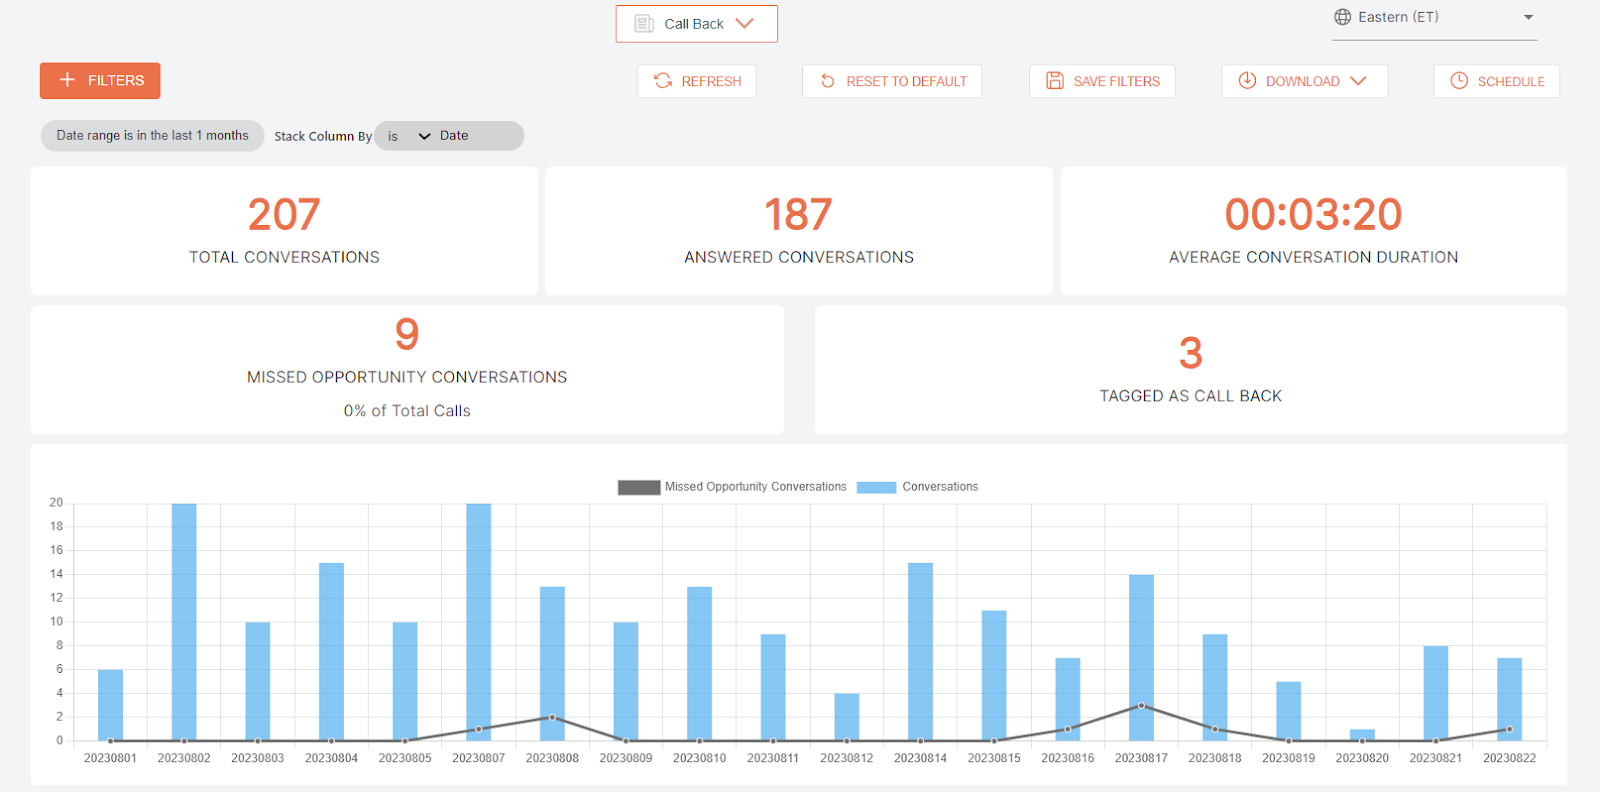

This report shows Total calls, Answered calls, Average Call Duration, and Missed Opportunity calls, and they are tagged as Call Back on the tiles. The graph shows Missed Opportunity calls against Total Calls for each day. The grid summarizes ‘Missed opportunity calls’ and ‘Tagged as call back’ calls.
Caller Activity Report
The Caller Activity Report summarizes all calls placed by individual caller IDs and, if available, then displays caller data append information.


The report graph displays the Top caller's Timeline for each day and the grid displays the information about each caller ID like Caller Name, Business Name, Address, Total Calls, Total Duration, First Call Date, Last Call Date, etc.
Call Logs Report
The Call Logs report provides Call Summary information, Call Trends over time, and limited individual call detail records, full call details are available for download and scheduling. The call logs give all the information about the calls, like the Duration, Date and Time, the tracking number the call was received for, the group name, campaign name, Etc.

The call logs report tiles show Total Calls, Unique Calls, Answered calls, Average duration for the calls, Total leads percentage of total analyzed calls, and the Total conversion percentage of total analyzed calls.
As mentioned, the grid shows all the details about the calls, like Date/Time, Group name, Campaign name, Tracking Number name, Ring to phone number, Ad source Etc. It also provides us with the ability to email the call, Add tags and comments. The user should be able to download the call from here from the call logs report under action. A couple more functionalities like identify agent and block/Unblock are available here in this report.
Review calls will enable the user to be directed to a particular conversation.
The user can play the call from this report and review the transcript and summary and conversation.
Call Logs Extended Report
The Call Logs extended report provides extra information about the call logs. There are 3 types of extended reports available under the download option. The reports can be downloaded in CSV and PDF format.
Detailed info - This report provides detailed information about the calls.
Call scores - This report provides scoring-related information about the calls.
DNI Info - This report provides DNI-related information about the calls.
Conversation Overview Report
The Conversation Overview provides a visual presentation of the calls.


Conversation overview reports to display the general information about the Conversation. The tiles for Total Conversations, Unique Conversations, Unanswered Conversations, Leads, Conversions, Missed opportunity, Webhook tagged, Longest Conversation, and Average Conversation duration are available.
The graph for Conversations, Leads, and Conversions Overtime shows the same daily information. Conversations by Tracking Numbers show the number of conversations for each tracking number. Conversations by Campaigns show the number of conversations for each campaign.
Conversations by Region Report
Conversations by region report shows the conversations by every region, which includes states and zip codes.
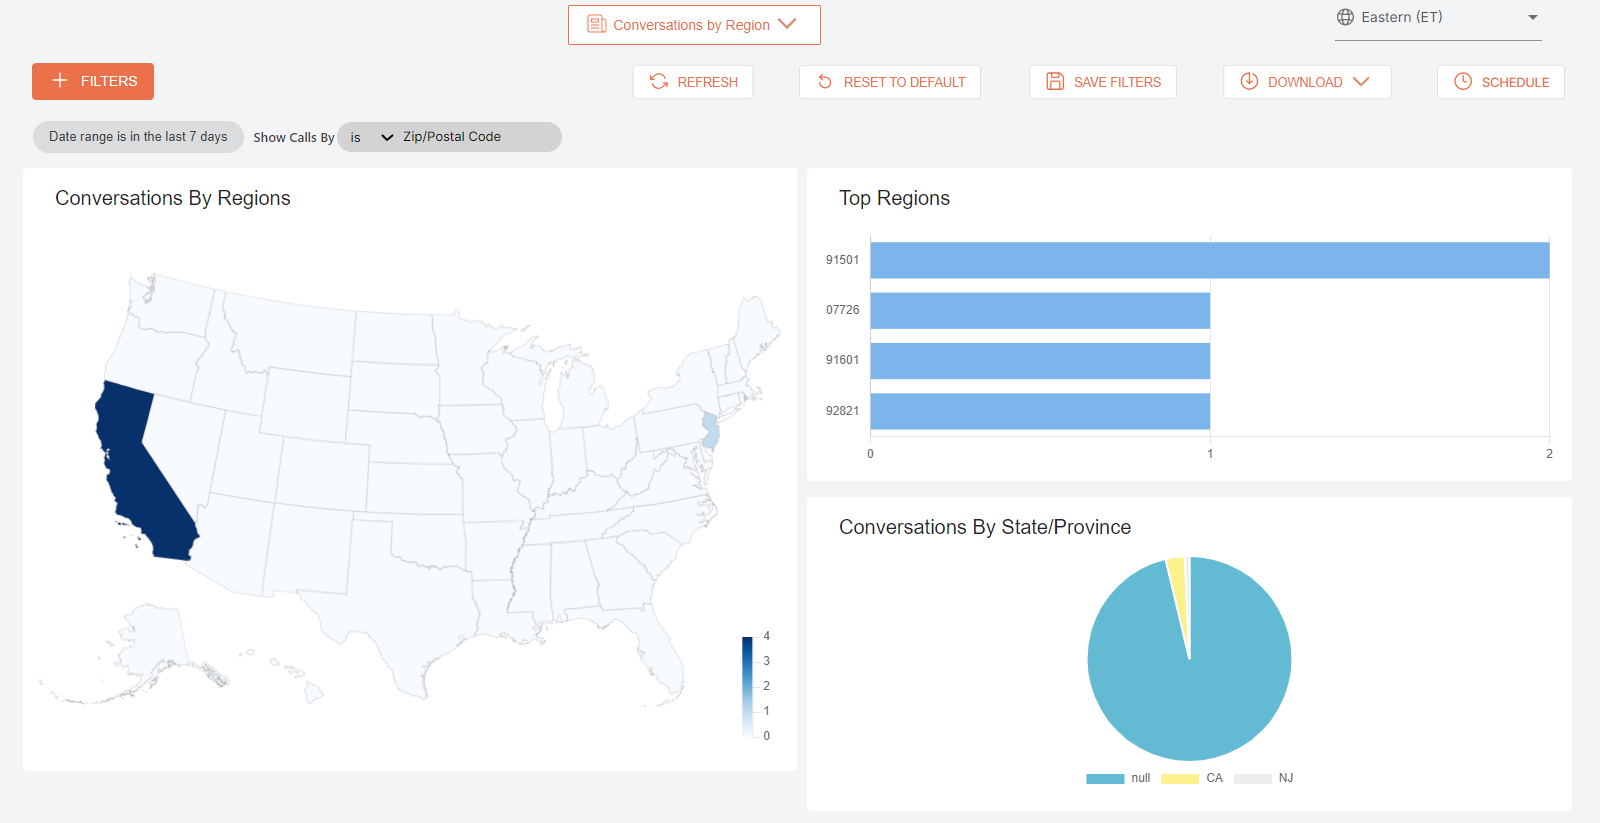
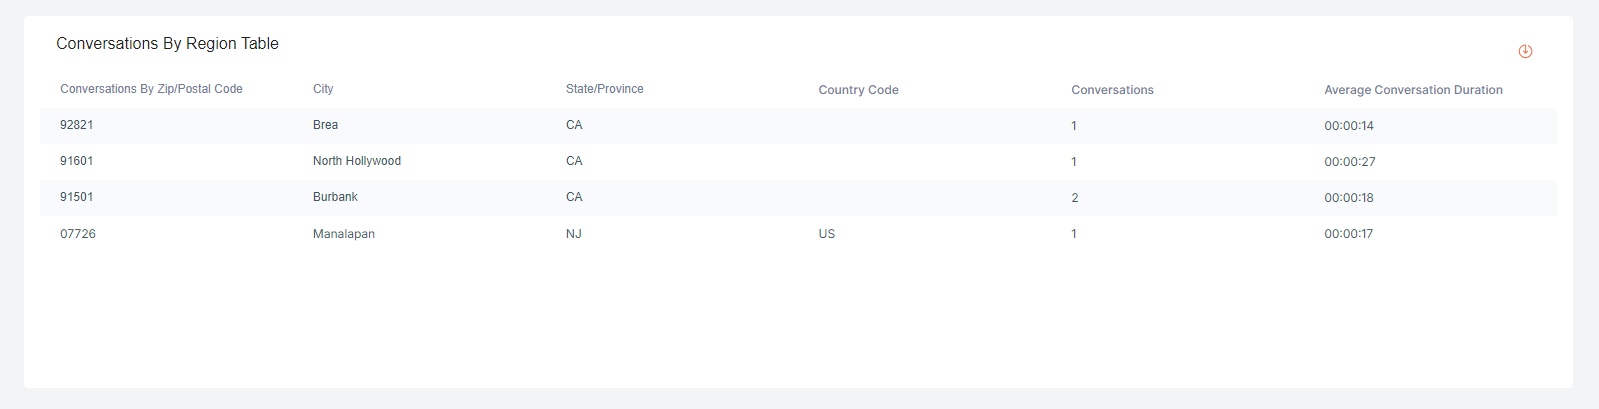
The conversations by region graph show statewide conversations, Top regions graph shows the zip codes with the number of conversations for every zip code. Conversations By State/Province is the pie chart showing calls for different states. The conversations by regions table show the data for Conversations By Zip/Postal Code, City, State/Province, Country code, Conversations, and Average Call Duration for every zip code.
Conversation Trends Report
The conversation Trends report shows the trends for the Conversations over time.
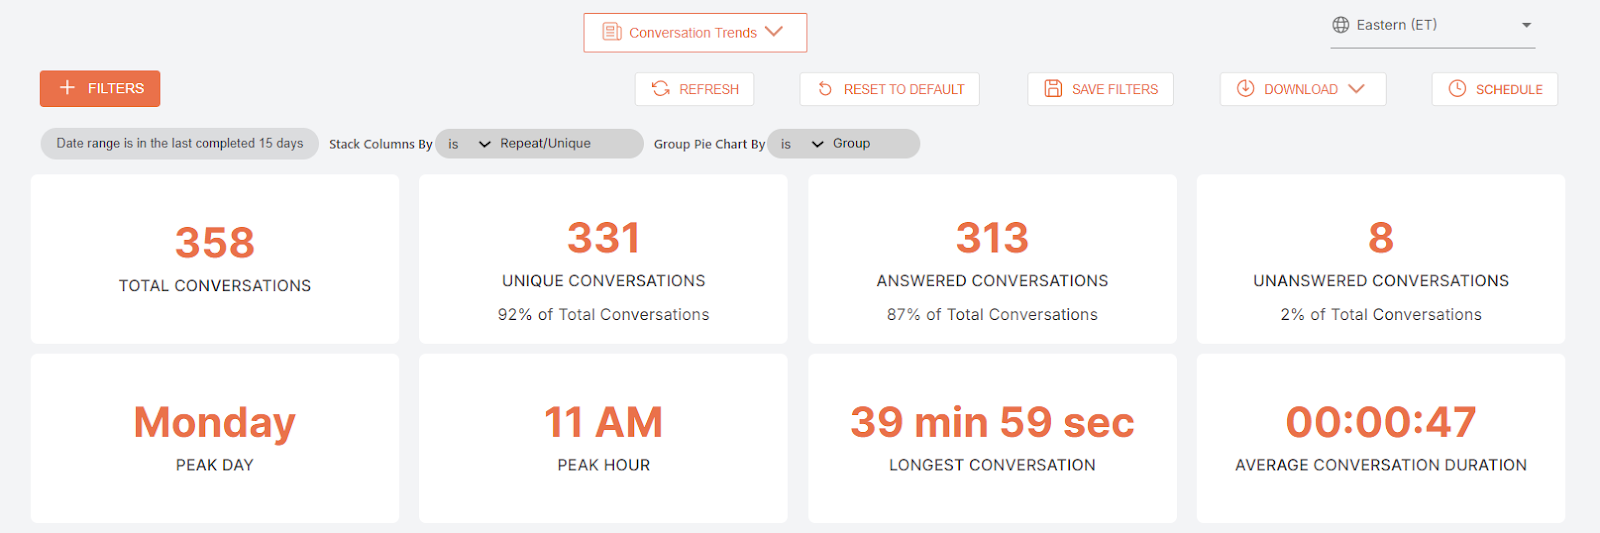
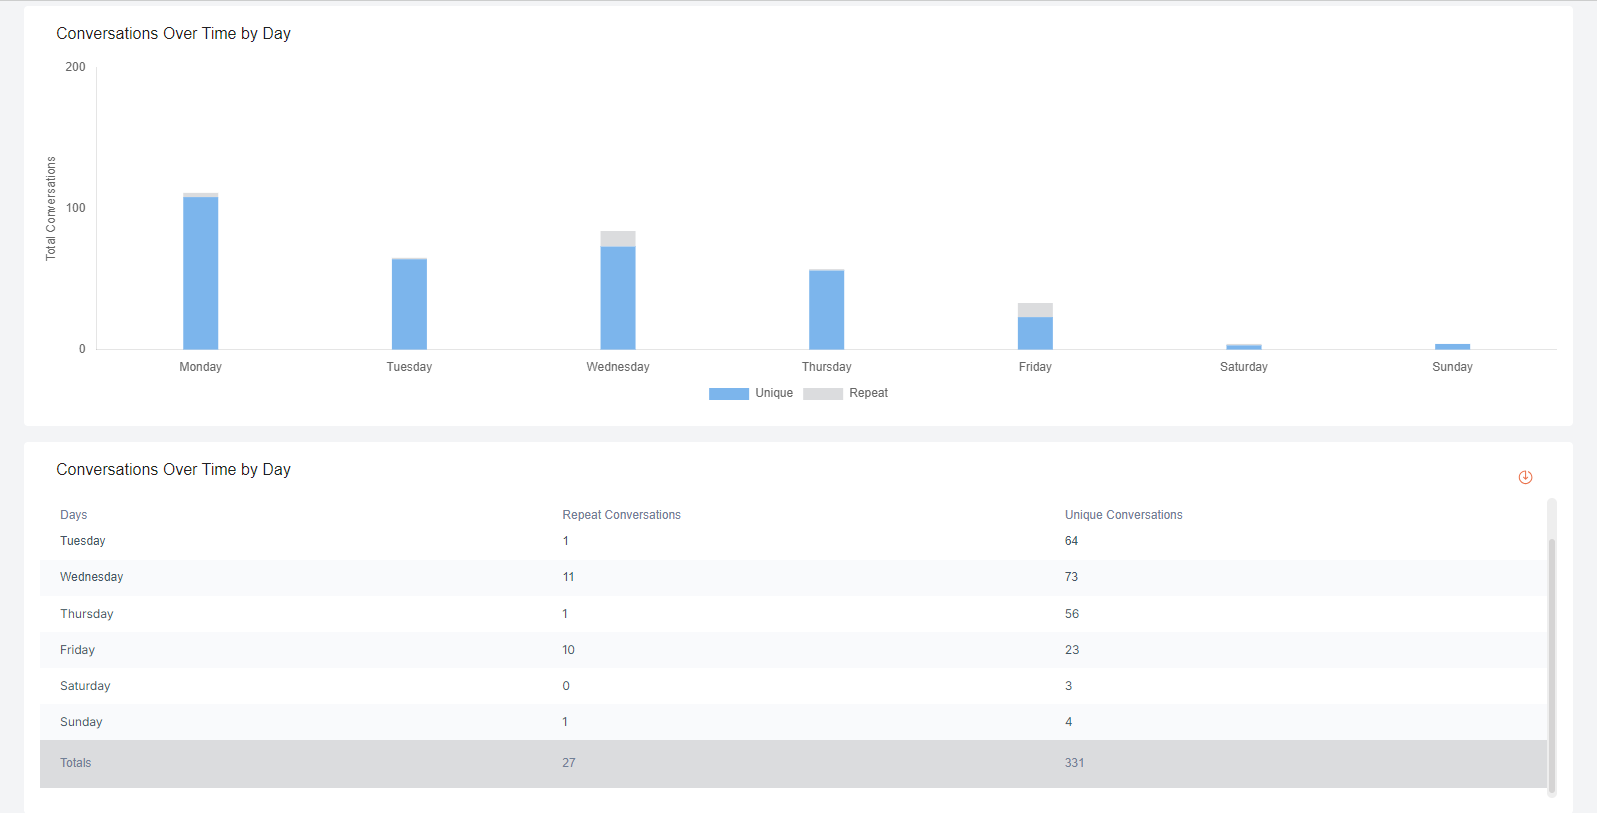
The conversation trends report shows Total conversations, Unique conversations, Answered conversations, Unanswered conversations, Peak days, Peak hours, Longest conversations, and Average conversation duration. The conversations Over Time By Day graph shows the total conversations for every day of the week. It also shows the unique conversations and repeated conversations as well. The conversations Over Time By Day table shows the same data in the grid format.
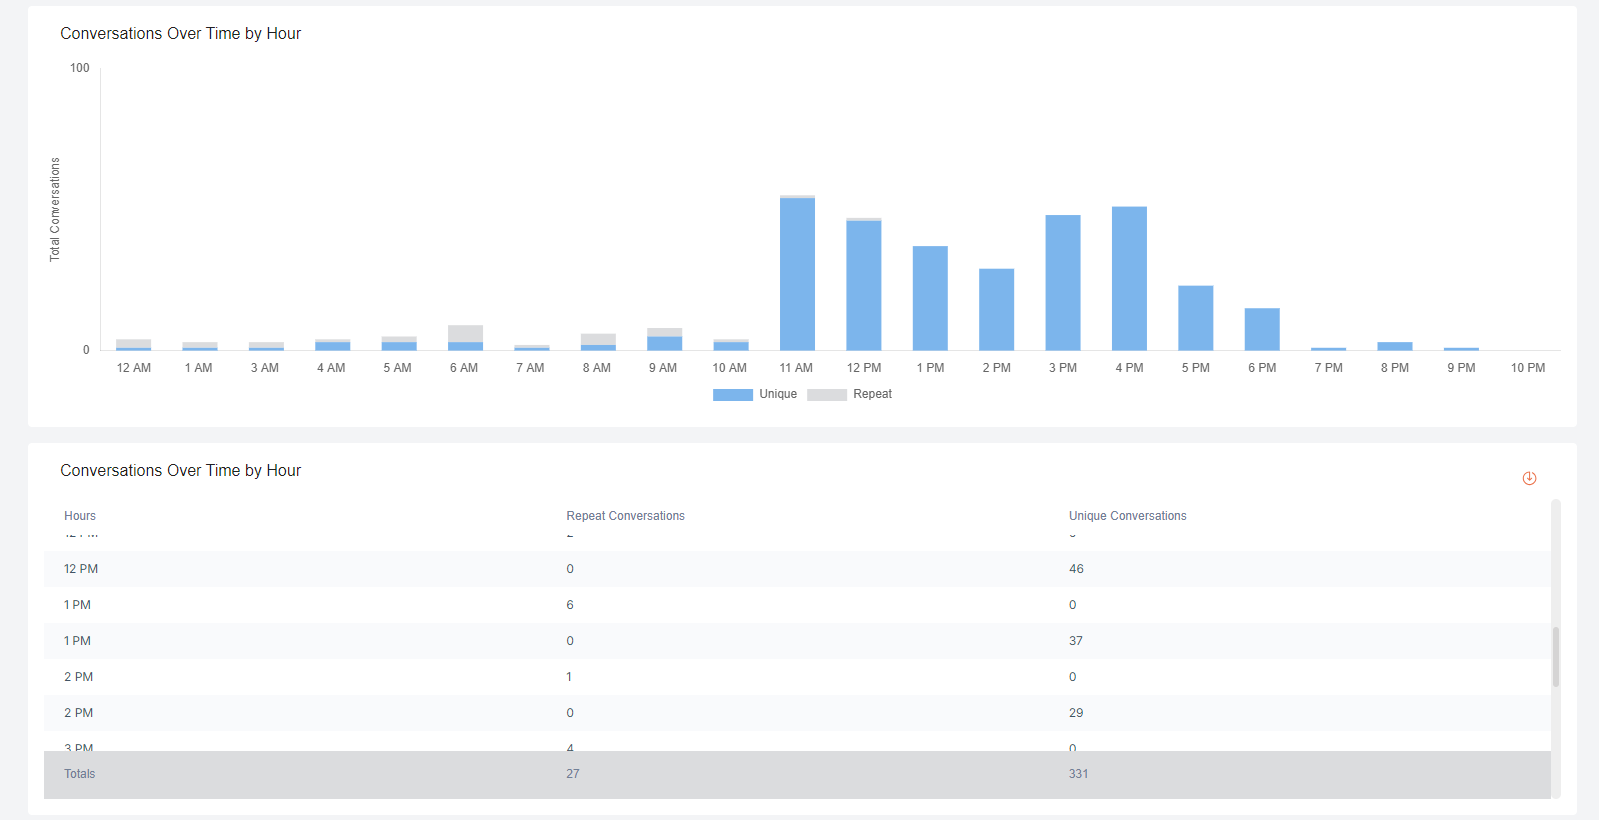
The conversations Over Time By Hour graph shows the conversations with Unique and Repeat conversations for every hour of the day. The same data is presented in the grid format in the Conversations Over Time By Hour table.
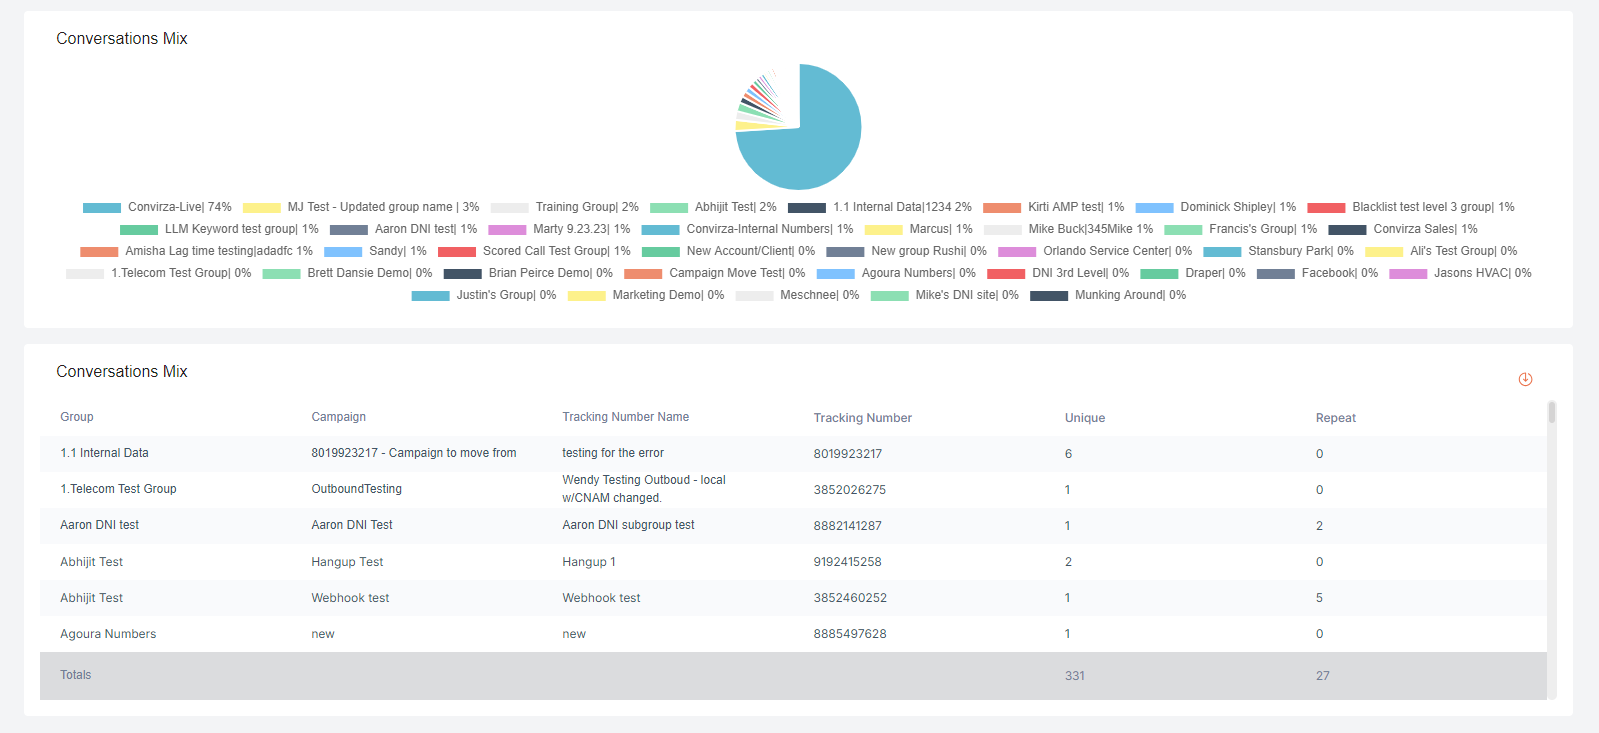
The conversations mix graph shows the number of conversations for every group in the pie chart, and the same data is shown in the call Mix table in the grid format.
Group Insights Report
The Group Insights report shows groupwise data for conversations and billable minutes.

The Group Insights report tiles show the data for Total Conversations, Total Analyzed Calls, Billable Minutes, Total Analyzed Minutes, Total Leads, Conversions, Total Conversations Value, Total Conversations.
The grid shows the columns for ID, group Name, External ID, Conversations, Analyzed Conversations, Billable Minutes, Analyzed Minutes, Leads, Conversions, Conversation value, Unique, Voicemail, Answered. All this data is segregated for every group.
IVR Keypress Report
IVR keypress report provides the details of the conversations for the tracking numbers with keypresses.

The grids for Total calls, IVR paths, Average time in Menu, Abandoned calls, Number of unused paths, and total conversion.
The path performance grid shows the data for Group|External ID, Campaign|External ID, Tracking Number|Tracking Number Name, Tracking Number Type, IVR Path, Total conversations, Average conversation Duration, Abandoned conversations, Abandoned Rate.
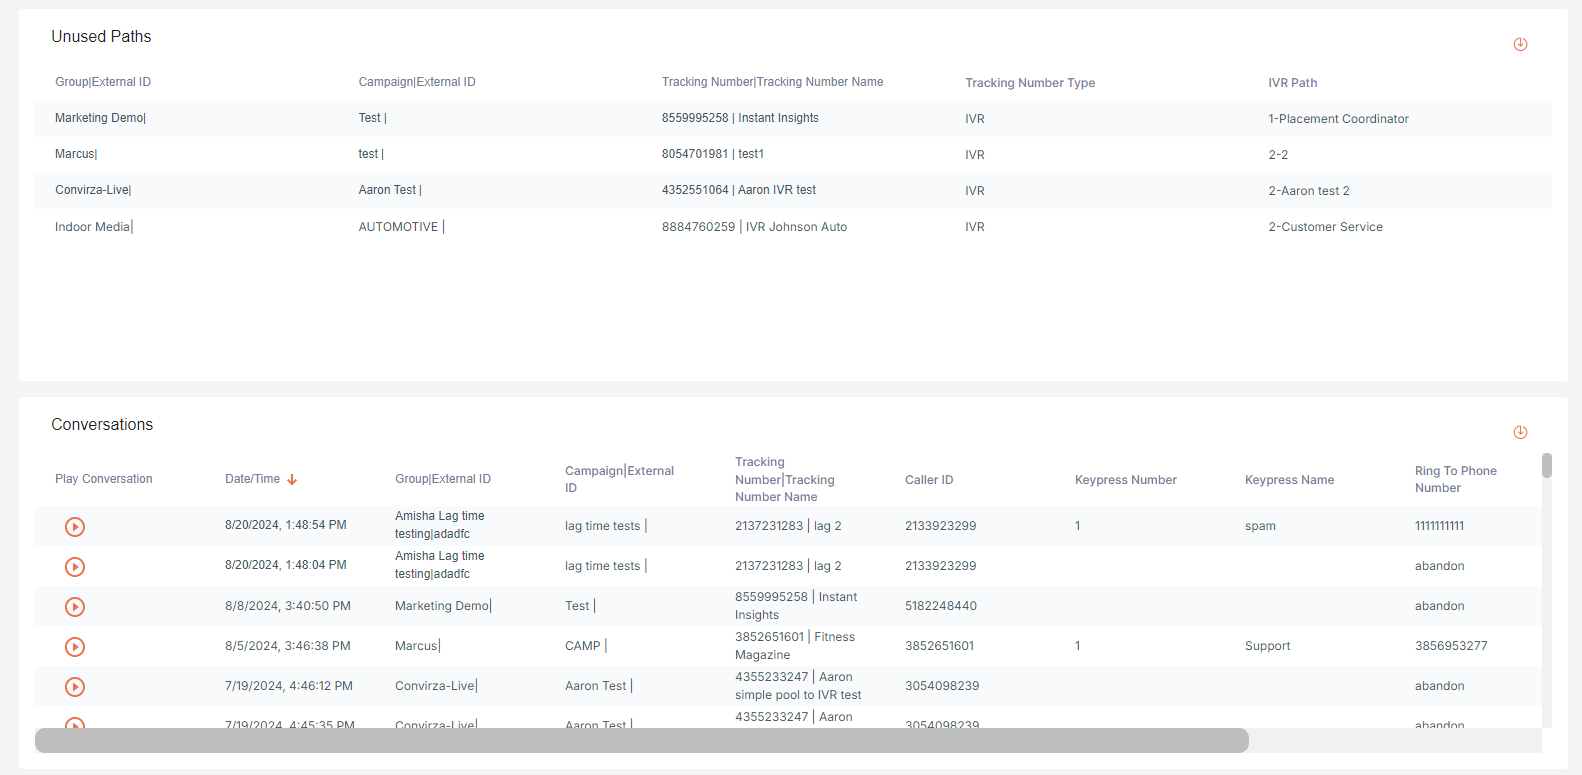
Unused paths grid shows the data for Group|External ID, Campaign|External ID, Tracking Number|Tracking Number Name, Tracking Number Type, IVR Path and gives the information about the paths which are never used.
The grid for calls gives the same information about every call separately. It shows the data for the Play call, Date/Time, Group|External ID, Campaign|External ID, Tracking Number|Tracking Number Name, Caller ID, Keypress Number, Keypress Name, Ring To Phone Number, and Total Duration.
Manager Insights Report
The Manager Insights report breaks down how the agents/teams performed during the call and how the call went overall.


This report shows the average overall score for the agent/all agents, tiles for Scored conversations, Reviewed conversations, Conversion rate, etc. It also shows the performance, indicator-wise, of the top-performing agent and all other agents. Grids for Champion calls and Coachable calls are also available. Champion calls are calls where the agent performed exceptionally well, and Coachable calls are calls where the agent needs to improve their skills.
Please note that the Champion and Coachable calls will only be shown for the scored calls.
Analytics Summary Report: (Available only for old customers)
The Analytics Summary report breaks down what happened during a phone conversation using Call Indicators and Conversation Analytics.

This report shows you numbers for the highest converting indicators out of the total calls the indicator was found on. It provides data on how many calls the indicator hit and how many calls it missed. Also, it gives you a grid for all the indicator names with Analyzed calls, Total Hits, Hit percentage, Total Misses, Miss percentage, etc. So this is an excellent report to help you make sense of the data for the indicators Convirza provides.

Marketing Dashboard Report
The marketing dashboard report provides the Groupwise segregated information about the conversations.


The tiles for the marketing Dashboard report show the data for Total conversations, Leads, Conversions, and Average conversation Duration.
The Conversations Mix graph shows the total number of conversations for the groups in the account, and another graph shows the highest converting conversations for every group.
Usage summary by group grid shows the data for conversations by Group, Repeat caller, Disposition, Total conversations, Leads, Lead % of conversations, Conversion, Conversion % of conversations, Total duration, Average duration, Missed opportunity and Missed Opportunity % of conversations.
Marketing Dashboard Extended Report
The Marketing Dashboard extended report provides extra information about the conversations. The extended report is available under the download option with name detailed info. The report can be downloaded in CSV and PDF format.
Tags Summary Report
The tags summary report provides information about the tags used for the calls.

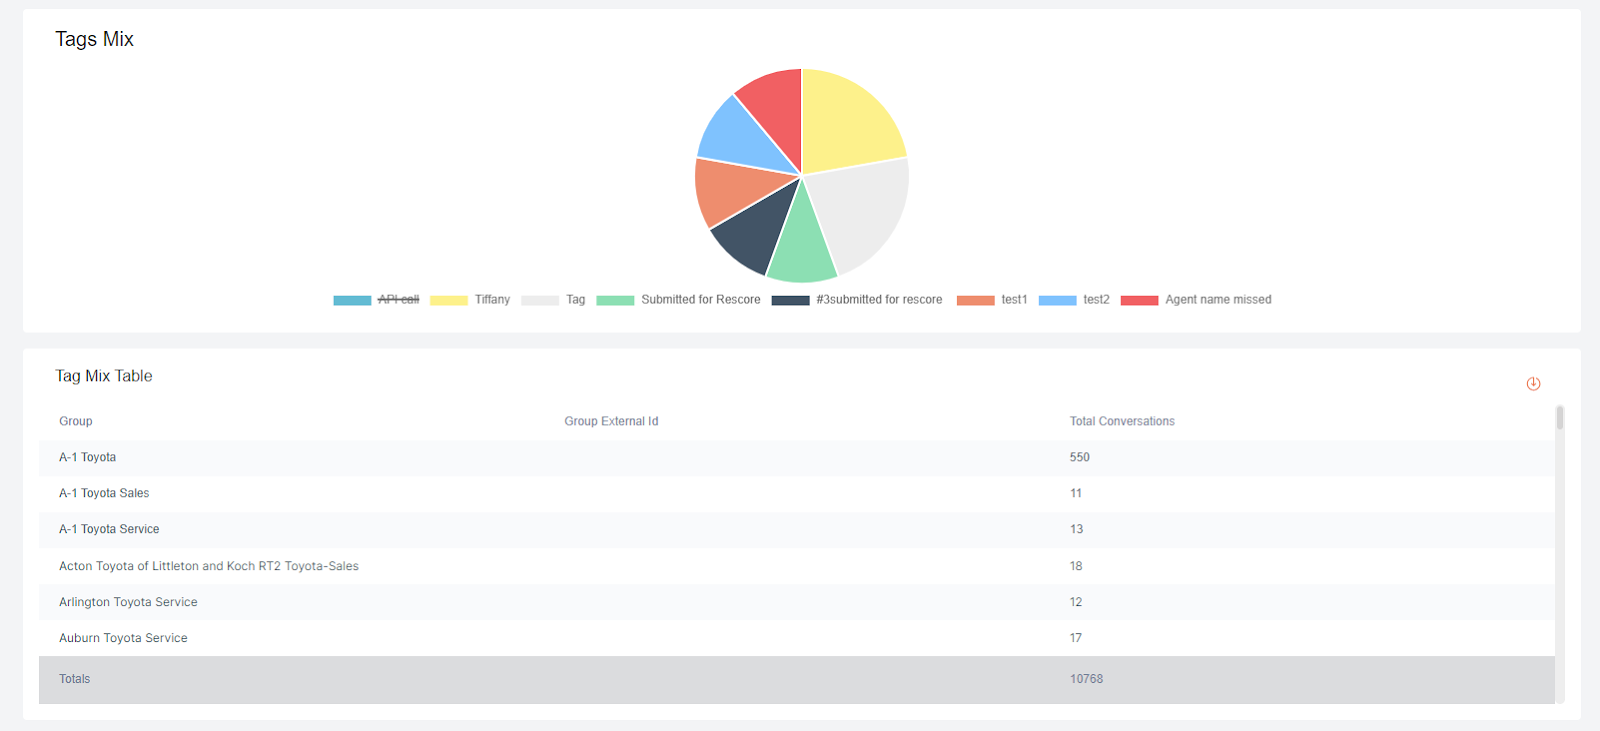

Tags over time graph show the number of tags added on every day. Tags Mix graph shows the number of times every tag is used in the call. Tag mix table shows the data for Group name, Group External ID and the number of tags added to every group. Tag Summary Report shows the columns for Tag, Group, Group External Id, Conversations Tagged, Total Duration, Average Call Duration.
Tracking Number Settings Report
The tracking number settings report shows all the settings for the tracking numbers in the app. TN name, Campaign name, Ring to number, and conversation action columns have clickable links that will direct you to the associated page or show you more information.
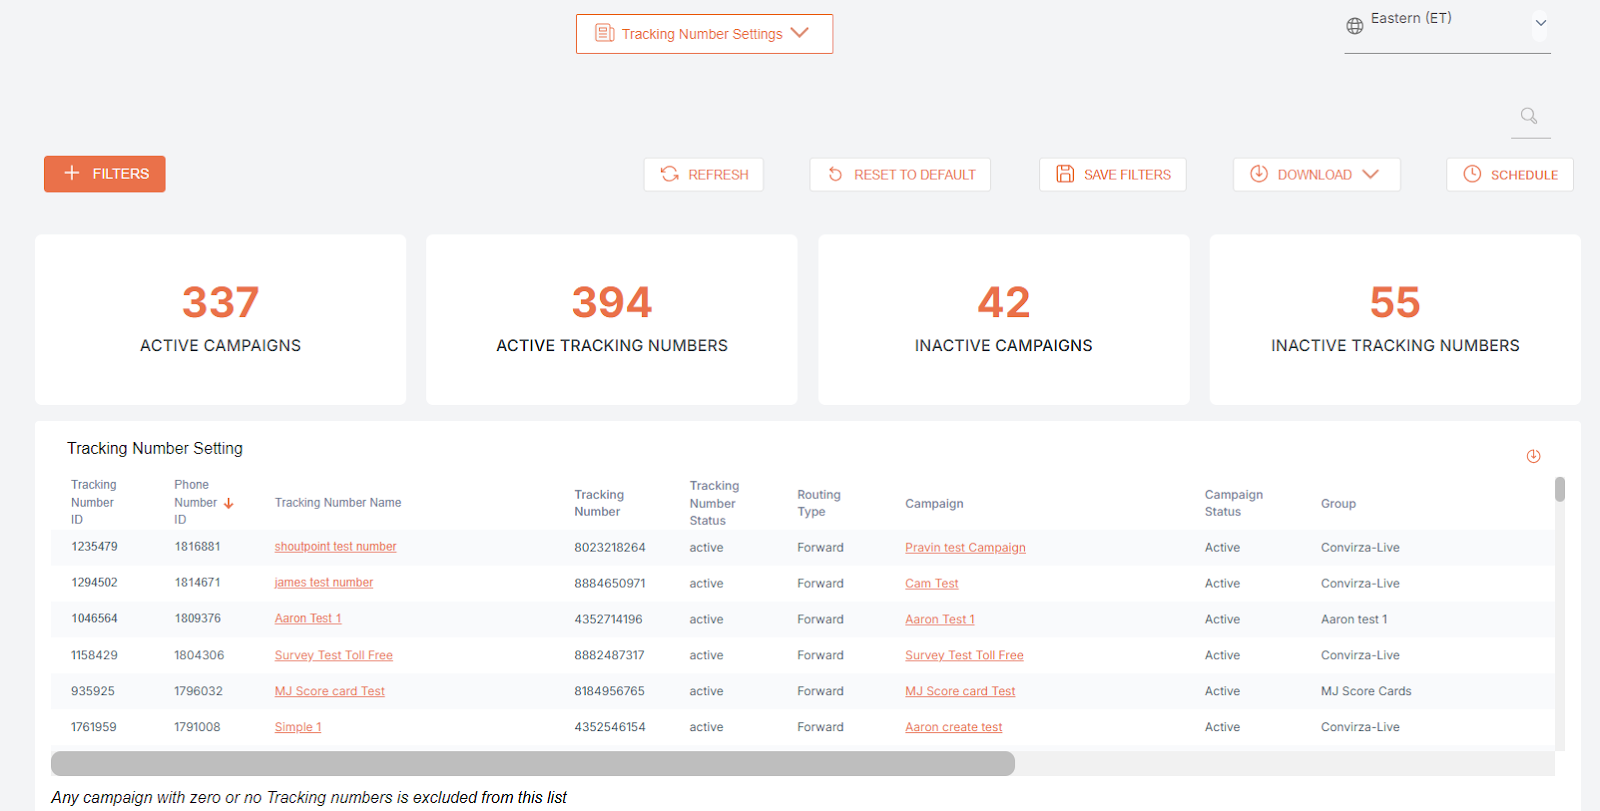
The tiles show the data for Active Campaigns, Active Tracking Numbers, Inactive campaigns, and Inactive Tracking Number. The grid has the following columns Tracking Number ID, Phone Number ID, TN Name, Tracking Number, TN Status, Routing Type, Campaign, Campaign Status, Group, Ring-to Number, Ad Source, Spam Guard, Record Call, DNI Type, Voicemail, Conversation Action. You can download the grid by clicking on the download icon on the top right-hand corner of the grid.
Another way to download the data for tracking Number Settings Report is to click on Download and select PDF or CSV. If you select the Detailed Info option, you will be able to download more information about the tracking numbers, which is called Tracking Number Settings Extended Report.
User Logs Report
The User logs reports show the user activity details.
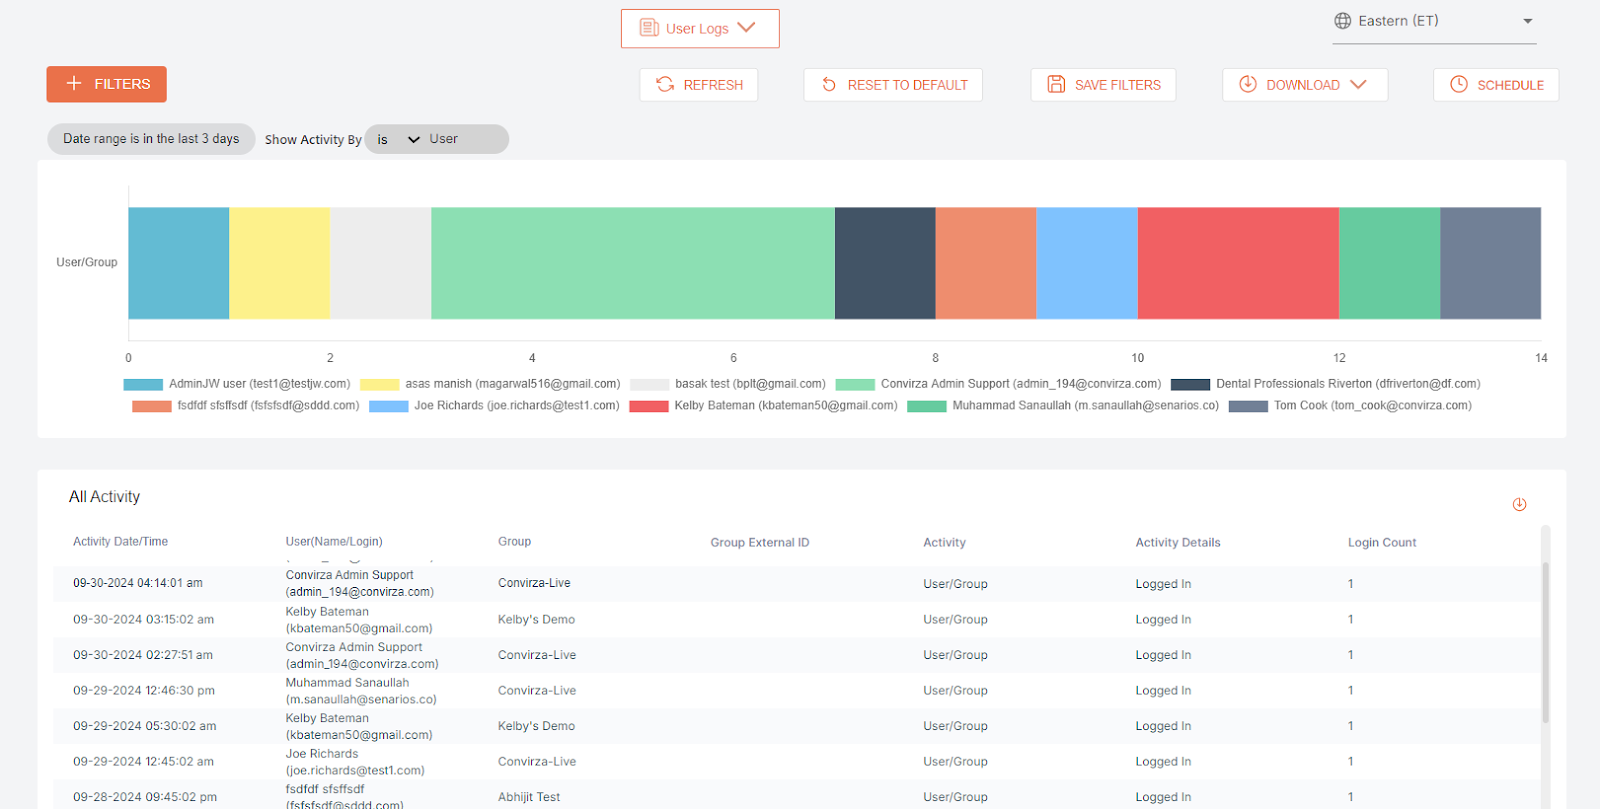
The first graph shows the user activity for Call actions, campaigns, integrations, IVR Routes, Scheduler, tracking numbers, Users/Groups, etc.
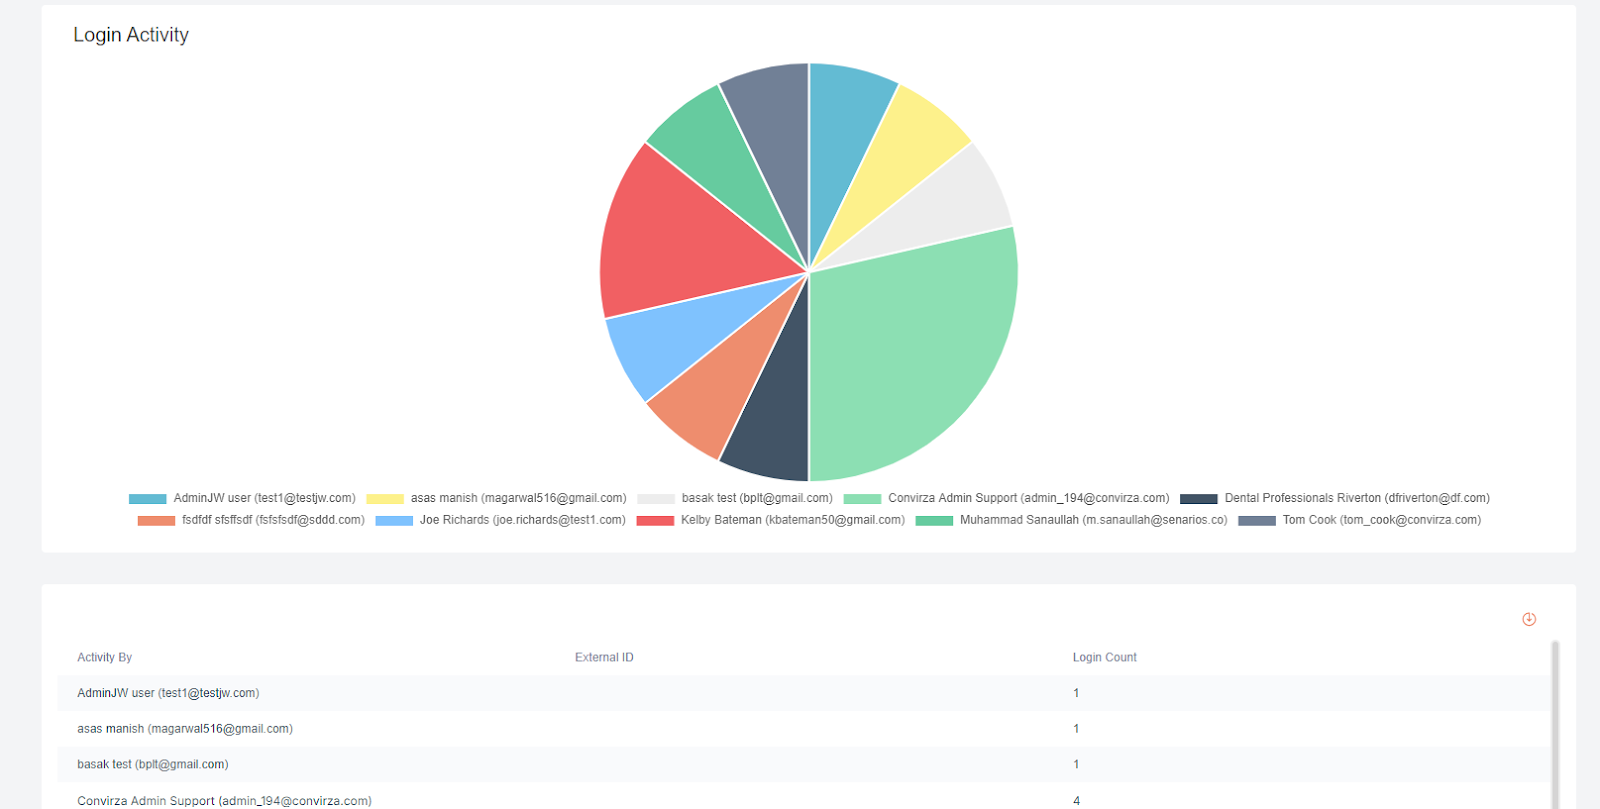
The grid shows the columns for Activity Date/Time, User(Name/Login), Group, Group External ID, Activity and Activity Details, and Login Count. The pie chart shows the login activity for all the users. The last grid shows the columns for every user's External ID and the login count for the user.
Webhook Logs Reports
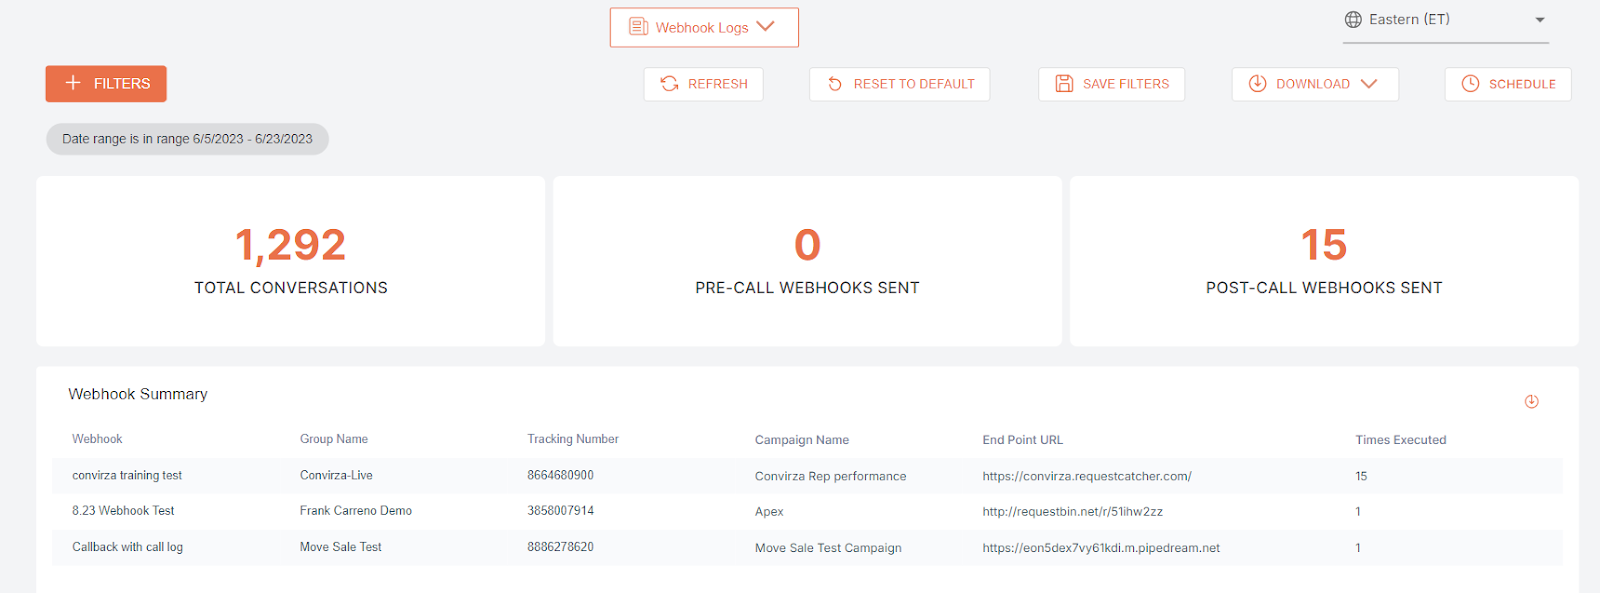
The webhook logs report shows the tiles for Total Conversations, Count for Pre call webhooks sent, and post-call webhooks sent. The Webhook Summary grid shows the data for Webhook, Group Name, Tracking Number, Campaign Name, Endpoint URL, and Number of times the Webhook was executed.
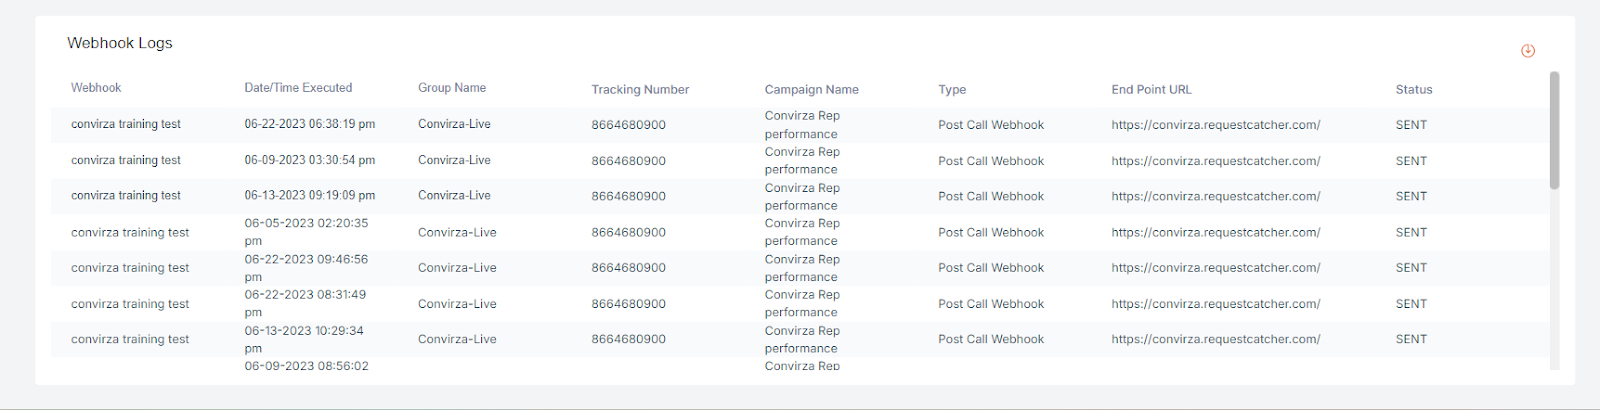
The webhook logs grid shows the data for the Webhook, Date/Time Executed, Group Name, Tracking Number, Campaign Name, Type, Endpoint URL, and Status.
Call Logs with Data Append Report
The Call Logs with Data Append Report provides information about the calls, similar to the Call Logs, along with additional information about the caller, like the Caller Name, Business Name, and Address. Full call details are available to download and schedule with this caller information.


The call logs report tiles show Total Calls, Unique Calls, Answered calls, and Average duration for the calls. The grid shows all the call details, like Duration, Date/Time, Group name, Campaign name, Tracking Number name, and Ring phone number, with caller information like Caller Name, Business Name, and Address.
The following reports are related to the call scoring.
Agent Insights Report
The Agent Insights report breaks down how the agent performed during the call and how the call went overall.


This report shows the average overall score for the agent, tiles for Scored calls, Reviewed calls, Conversion rate, etc. It also shows the performance, indicator-wise, of the top-performing agent and all other agents. Grids for Champion calls and Coachable calls are also available, which show the top 3 Champion and coachable calls. Champion calls are calls where the agent performed exceptionally well, and Coachable calls are calls where the agent needs to improve their skills.
Please note that the Champion and Coachable calls will only be shown for the scored calls. Single channel/SPAM/ Less than 30 seconds conversations are not considered Coachable/Champion Conversations.
Survey Report
The Survey report shows the data for the Agent Survey and Caller Survey added to the tracking number. The selection of a survey is a mandatory filter for this report.
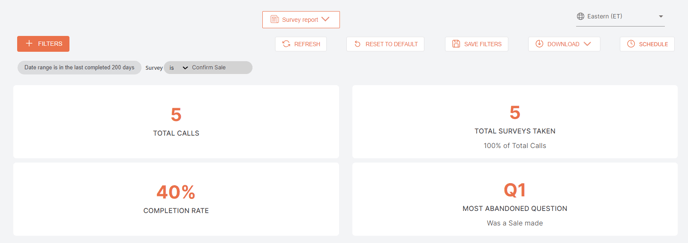
The survey report tiles show the data for Total Calls, Total surveys taken with % of total calls, Average survey time, Completion rate, and Most abandoned questions. It also shows two tabs for consolidated reports for the survey and individual reports.
Individual Report
The individual report shows detailed data about all the questions and the answers. A pie chart is displayed if the answer type is yes or no. If the answer type is a scale, then a bar chart is displayed; if it is numeric, it is displayed in a bar graph. Answers are displayed in the grids as well.
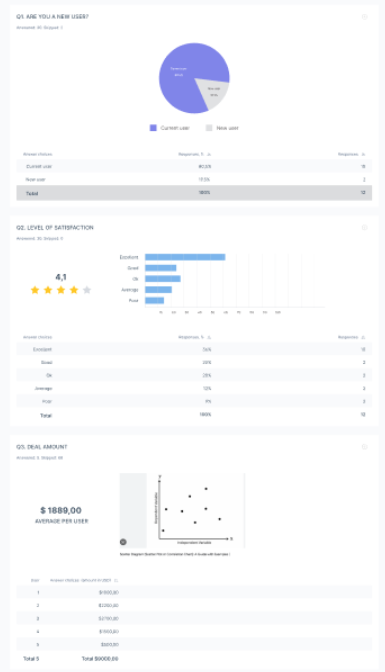
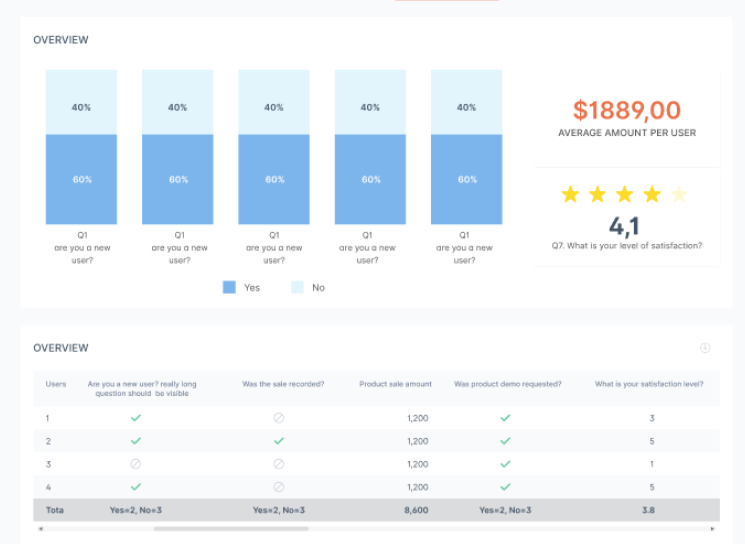
Consolidated Report
The consolidated report tab displays an overview of the collected data for all the questions as well as the data collected from each survey.
Scored Calls Report
Scored calls reports to show the data for the scored calls. This report has an insights filter as a default filter.
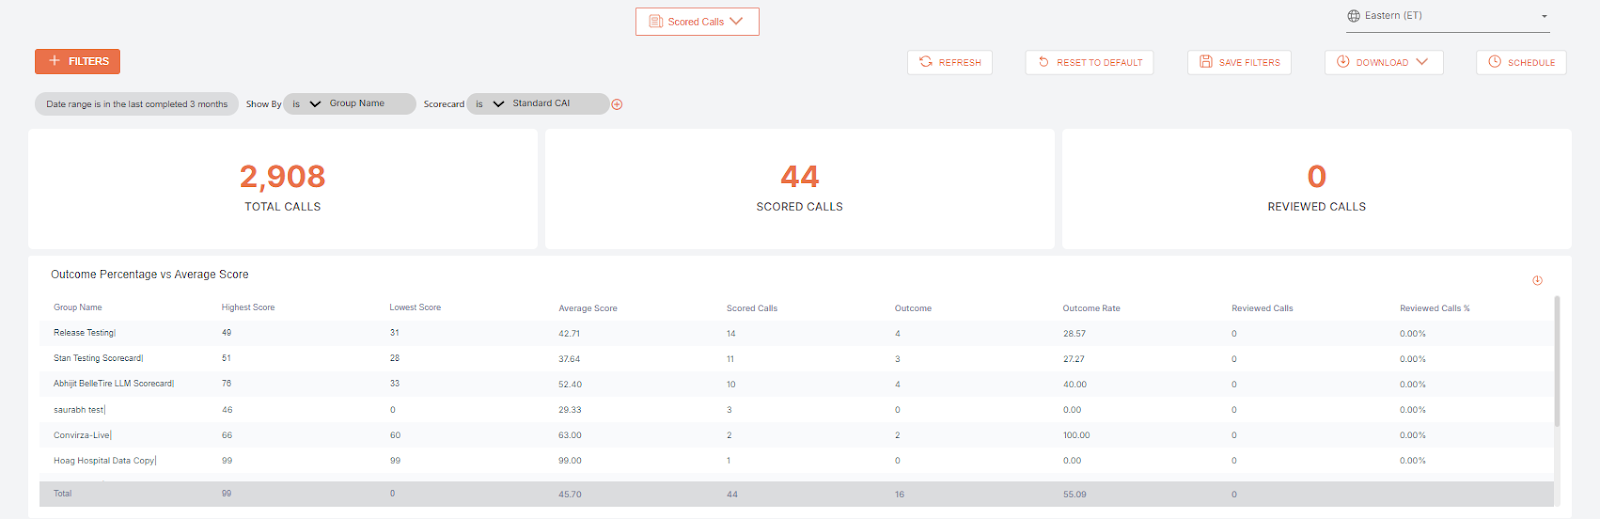
Scored calls Reports show the tiles for Total calls, Scored calls, and Reviewed calls. The outcome percentage vs. Average score grid shows the data for Group Name, Highest Score, Lowest Score, Average Score, Scored Calls, Outcome, Outcome Rate, Reviewed Calls, and Reviewed Calls %
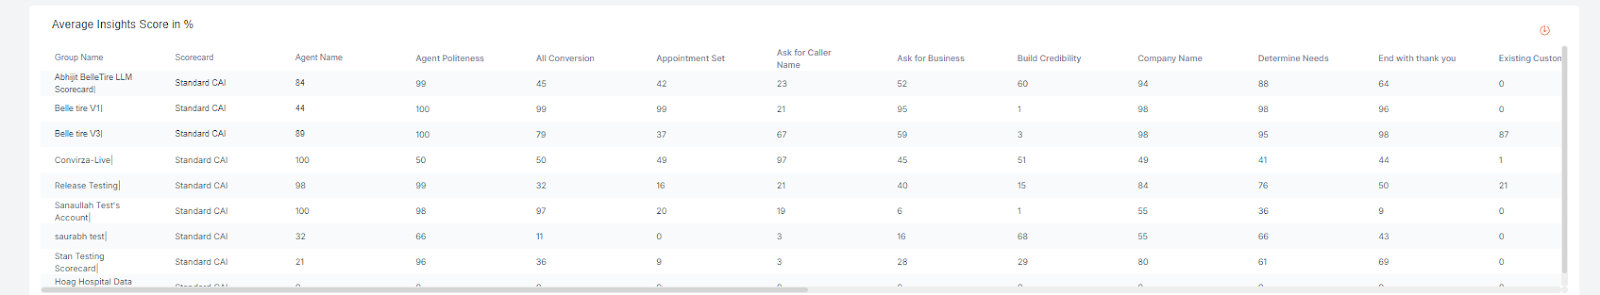
Average Criteria Score in % grid shows the data for Group Name, Scorecard, Test Indicator 1
Test Indicator 2, Acquire Customer Vehicle, Acquired Address, Agent Empathy, Ask for Business, All Conversion ©, Verbal Clarity. All the columns after the scorecard column are for the criteria in the scorecard.
Spam Guard Report
Spam Guard reports to show the data for the spam conversations. This report has an insights filter as a default filter.


The spam by region graph offers the spam conversations by every region. The tiles show the Total conversations, Actual Conversations and Spam conversations. The Spam conversations graph shows the daily number of actual calls and spam conversations
The spam conversations grid shows the data for Actions, Duration, Date/Time, Tracking Number, Caller ID, Ring-to Number, Tracking Number Name, Campaign | External ID, Group | External ID, Tracking Number Type, City, and State
SMS Logs Report:
The SMS Logs Report offers comprehensive insights into SMS conversations, similar to the detailed information available in Call Logs. This report provides information about all the text messages sent and received on the SMS-enabled tracking numbers.
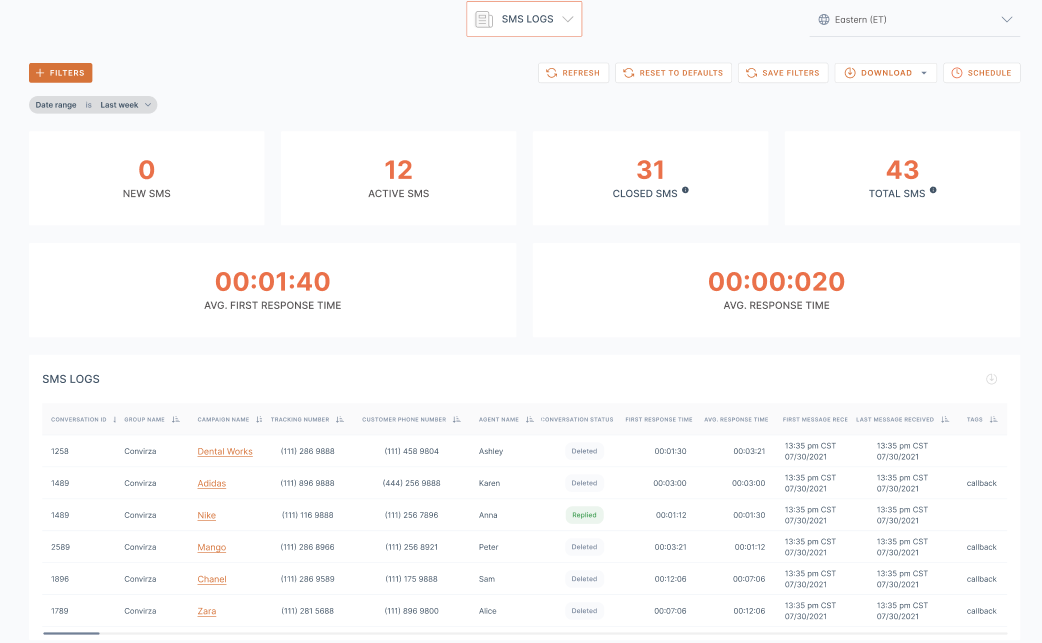
SMS logs Report shows the data for New SMS, Active SMS, Closed SMS, and Total SMS. Average first response time and Average response time for the agents is also displayed.
The SMS logs grid shows the data for the Conversation ID, Group Name, Campaign, Tracking Number, Customer Phone Number, Agent Name, Conversation Status, First Response time, Avg. Response time, First Message Received, Last Message Received, Tags, Number of Messages.
We also have SMS logs with detailed information available, which shows additional data about DNI settings, SMS and email notification information, and transcription.