Once the user logs in, they will be directed to the Dashboard page, which displays essential information as follows:
The Dashboard features two main sections: Insights Analytics and Call Tracking Analytics.
- Insights Analytics provides data based on the selected Scorecard from the dropdown menu.
- Call Tracking Analytics offers information regarding conversations.
Users have the option to filter data by Today, this Week, this Month, this Quarter, and this Year. Additionally, they can select a specific date range. For all selected filters, except for the date range, the corresponding dates will displayed.
Table of Contents
Click to quickly access specific sections
CAI - Convirza Actionable Insights - Introduction
- Conversation Analytics® services are designed to automate listening to and responding to call behavior. CAI offers the industry’s largest set of powerful Insights created from over 40,000 hours of data science research analyzing call conversations. The extensive research helps you improve visibility into campaign performance, accurately identify conversions, lead quality, sales inquiries, and missed opportunities, and reduce the costs and complexity of manual call listening.
- CAI’s library of call language is the foundation required to enhance conversation analysis accuracy. This is an area where CAI is drastically different from its competitors. We have created the industry’s most comprehensive library of conversation language to analyze your conversations. The goal of creating this library is to identify the many different ways a person can say the same thing or indicate some behavior or outcome. It’s important to consider that our service determines who is speaking, the caller or the agent, using dual-channel call recording. This separation is critical because the language used by the wrong person can trigger false positives resulting in inaccurate results.
- The process begins by processing conversations evaluated using a proprietary transcription and advanced analysis engine. CAI detects words, word patterns, and even patterns and/or phrases in combinations that indicate certain events have occurred in a conversation. Once those insights are correlated with voice subtleties like tremors, context, volume, silence, and tempo, CAI then applies logic that produces the results.
- CAI’s logic processing incorporates word/phrase proximity e.g., near/not near, word/phrase corrections, weights, priority categorizations, and other elements to identify specific events and factors in each conversation. This approach provides you with Natural-Language Speech RecognitionTM and creates actionable results for customers. With this methodology, we can obtain an 84-95% accuracy rate, depending on the Insight, for identified events.
- Please note: A conversation must be at least 30 seconds long to be analyzed.
- The complete walkthrough for the CAI application is provided below.
Login and Authentication
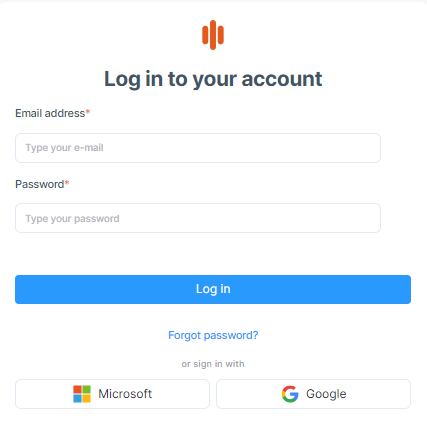
Here is the login/sign-up page for the CAI application.
Please enter the username and password to log in to the CAI application.
If the user clicks on the forgot password link, then the user will receive an email with the steps to reset the password. You can also link CAI with your Google or Microsoft account and log in using the same credentials.
When a new user is added, a one-time temporary password is sent to the user; the user goes to a special first-time login page, which has 3 fields (temporary password, new password, confirm password), and the password is changed to whatever the user sets up. Next time onward user can go to the login page and login with new set password.
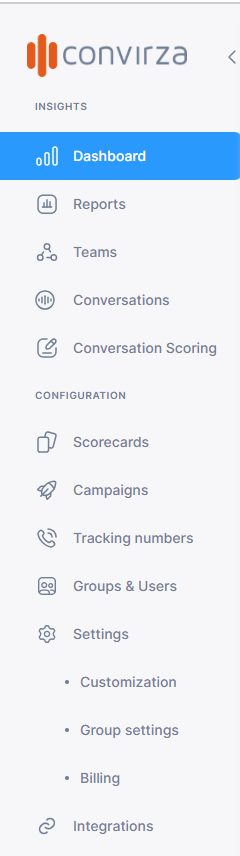
These options are listed on the left-hand menu.
There are two sections. Insights include Dashboard, Reports, Teams, Conversations, and Conversation scoring, and Configuration includes Scorecards, Campaigns, Tracking Numbers, Groups & Users, Settings (Customization, Group Settings, Billing), and Integrations.
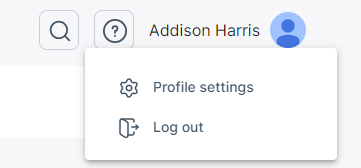
Log-out and User Profile (settings) are included under the logged-in user’s profile Icon in the right-hand corner.
Breadcrumb
The option to choose the location/Group for which you would like to see the data in CAI is available on every page except for the Reports and Scorecards pages.Multi-selection breadcrumb (User can select multiple groups) for the Insights section.

Single selection breadcrumb (User can select single group) for Conversation section.
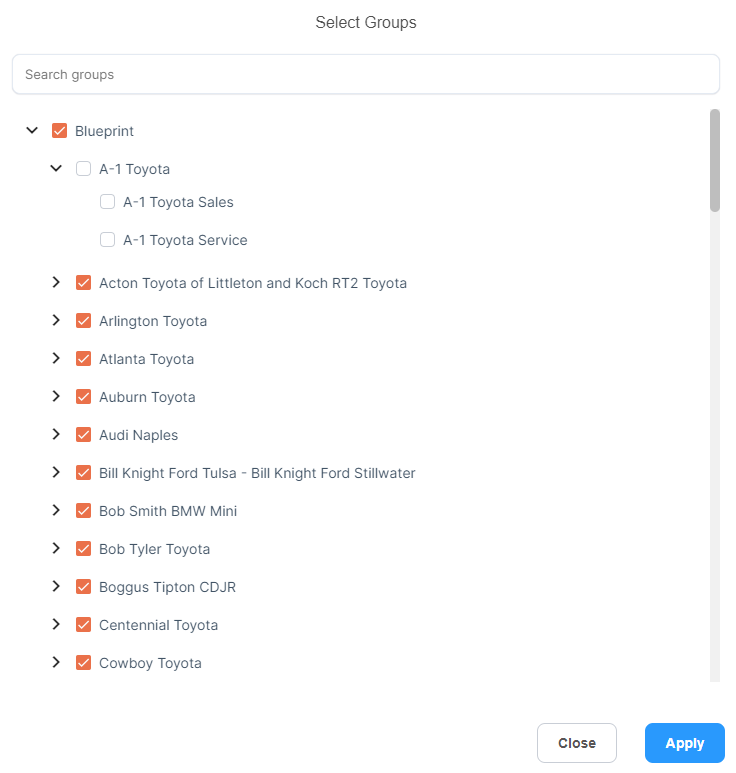
When clicked on the group name, the location selector will open.
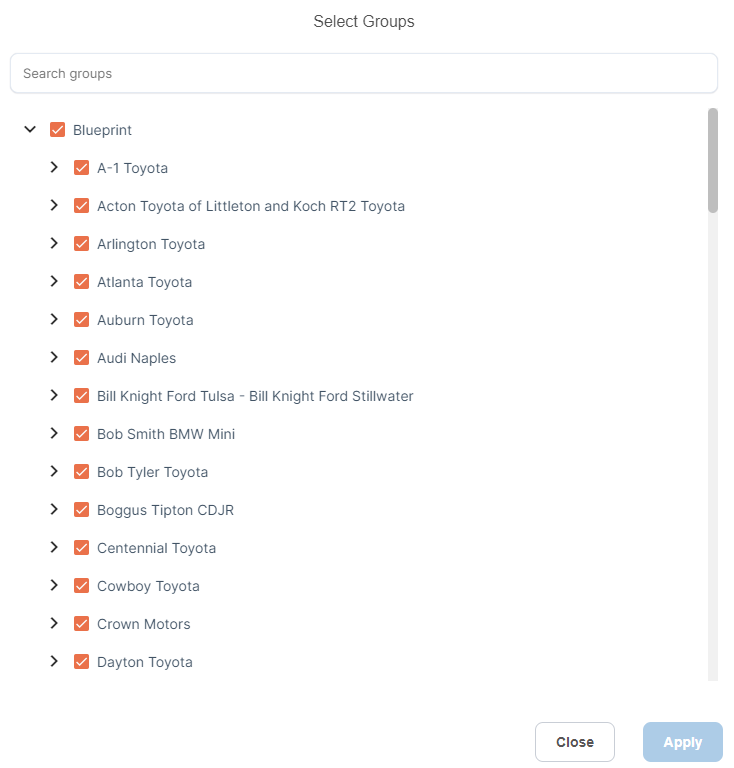
By default, all groups will be selected. The functionality works as follows:
- The first click will deselect the selected group and all its sub-groups.
- The second click will select only the group chosen by the user, excluding its sub-groups.
- The third click will select the chosen group along with all its sub-groups.
For example, consider the group ‘A-1 Toyota’
- 1st click. This will deselect the group ‘A-1 Toyota’ and its subgroups.
- 2nd click, This will select the group ‘A-1 Toyota.’
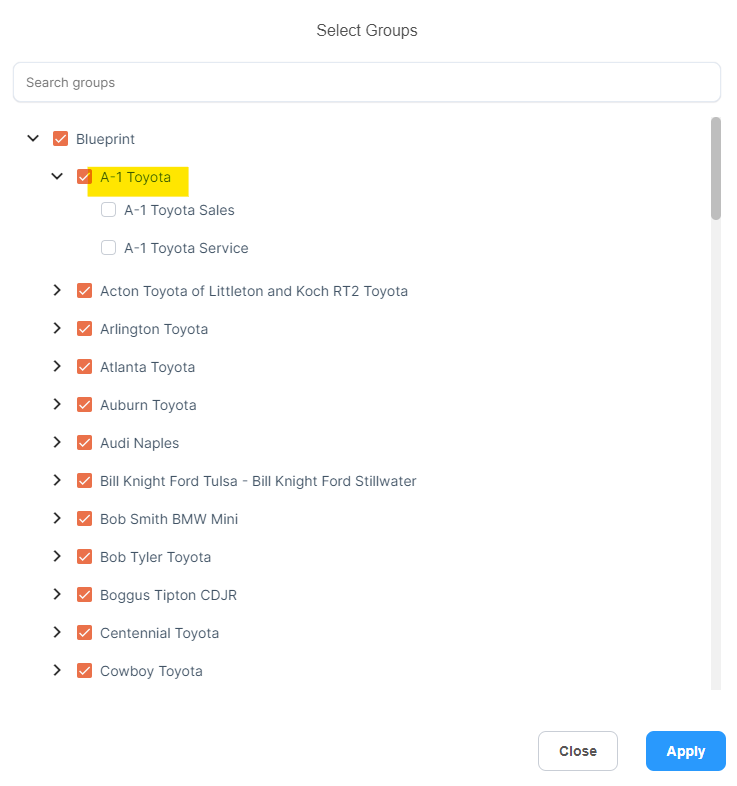
- 3rd click. This will select the group ‘A-1 Toyota’ and its subgroup.

Dashboard
Once the user logs in, they will be directed to the Dashboard page, which displays essential information as follows:
The Dashboard features two main sections: Insights Analytics and Call Tracking Analytics.
- Insights Analytics provides data based on the selected Scorecard from the dropdown menu.
- Call Tracking Analytics offers information regarding conversations.
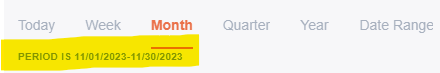
Users have the option to filter data by Today, this Week, this Month, this Quarter, and this Year. Additionally, they can select a specific date range. For all selected filters, except for the date range, the corresponding dates will displayed.
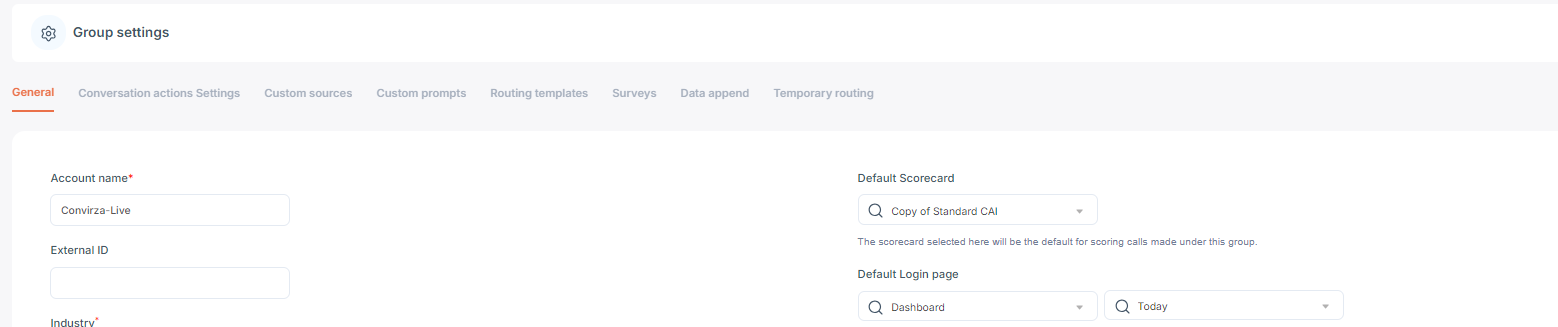
The user can select the default date range for the dashboard under Group settings→General page, default login page for Dashboard.
-
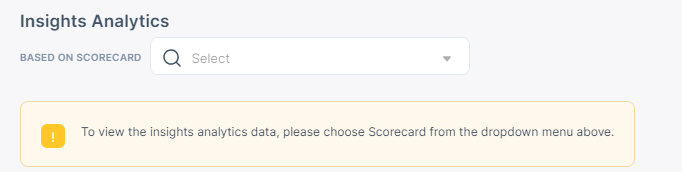
The following message is displayed if no Scorecard is selected in the drop-down.
Global Search
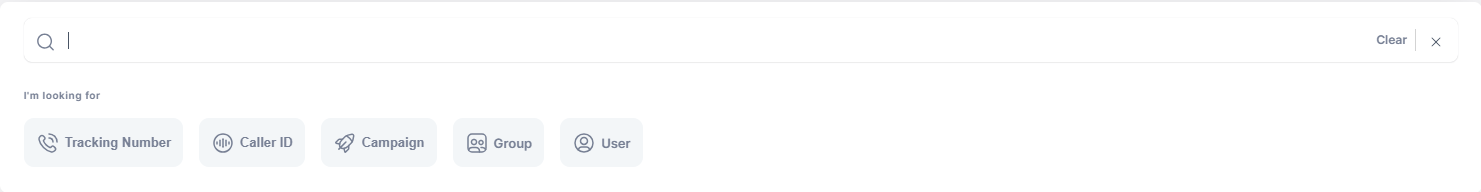
You can find Global search on top of every page in CAI.
This feature allows you to search for anything on the platform. You can further refine your search by selecting tracking number, caller ID, campaign, group, and user.
Each query will return several helpful results from the past 90 days. For example, when searching for the name "John," you will see a list of users with that name, conversations associated with those users, and more. By clicking on "Show More," you will be directed to the search page where you can refine your search using various filters.

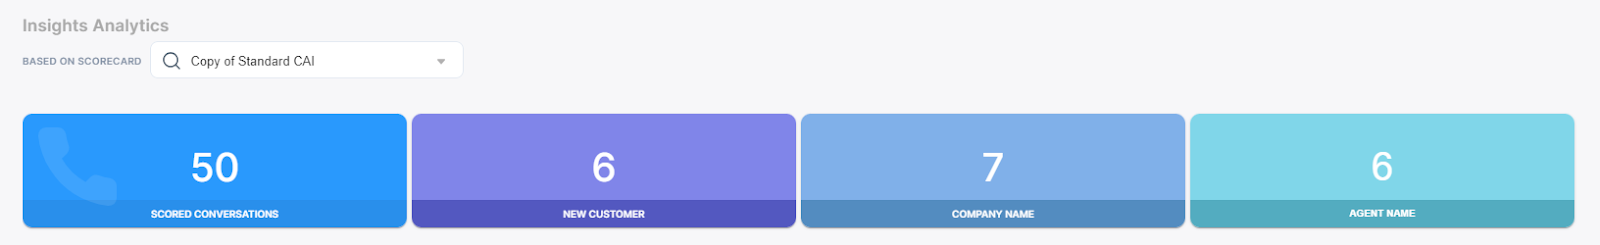
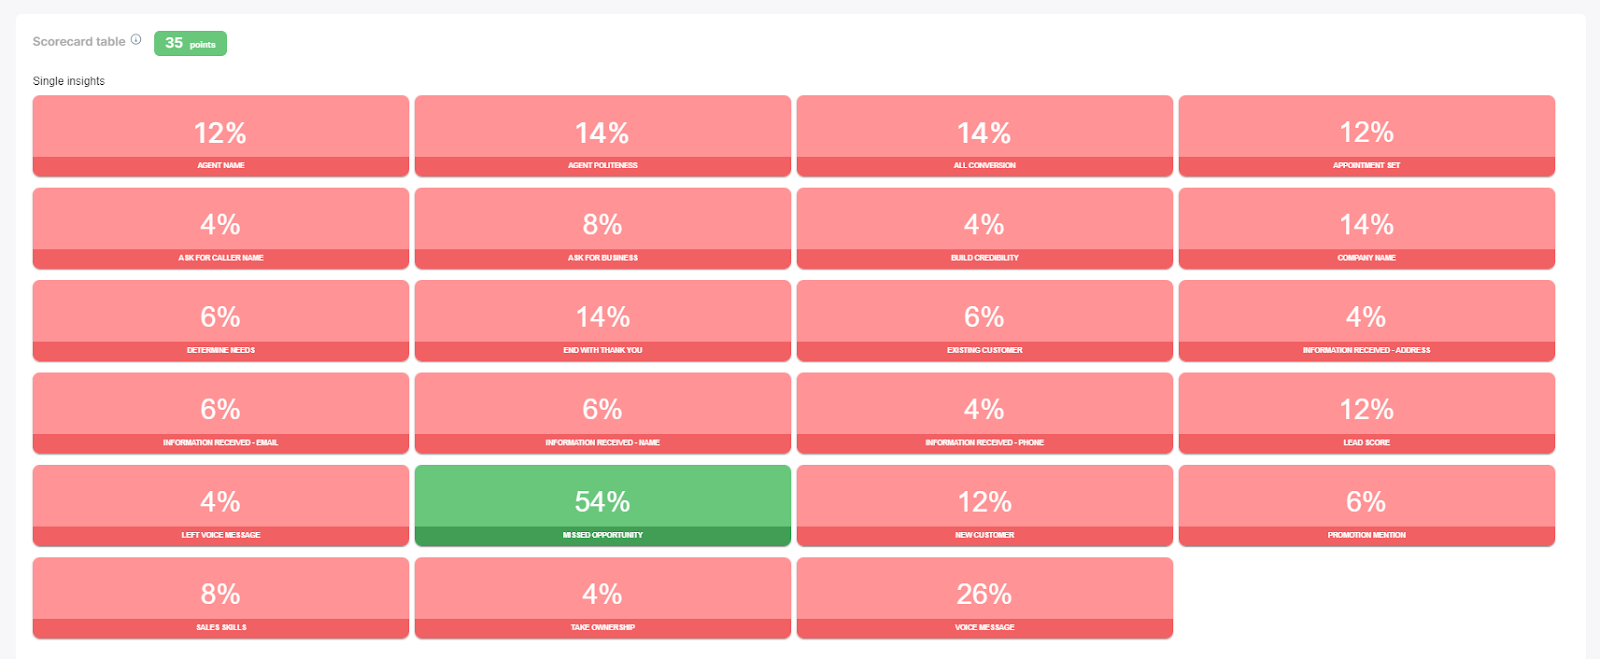
Insights Analytics
Insights Analytics displays tiles for Analyzed Conversations and the top three insights, along with their hit count, indicating the number of conversations where these insights scored between 51 and 100.
The number above the Scorecard table represents the average score for all analyzed conversations. The tiles for individual insights indicate the percentage of insights that received hits, which refers to the number of conversations where the insights scored between 51 and 100.
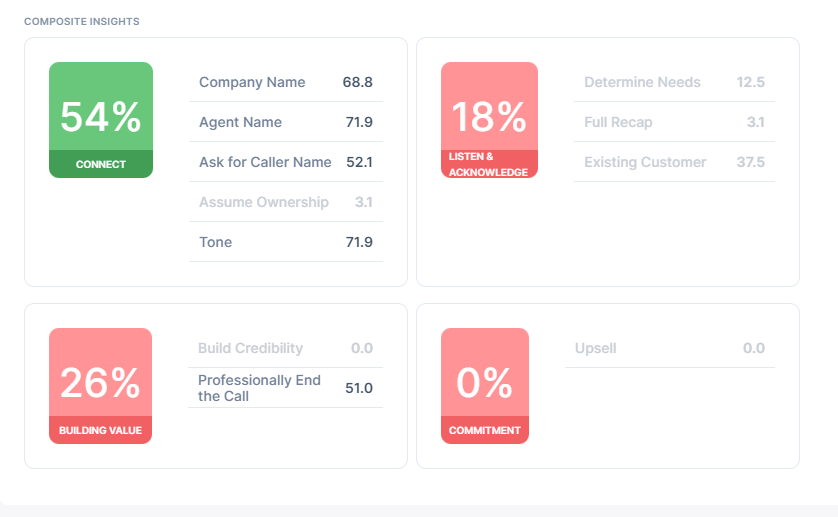
If the scorecard has sections, the scores are displayed below.
Conversation Analytics
Conversation Analytics shows the tiles for Total Conversations, Unique Conversations, Answered Conversations, and Missed Conversations (Which is not a part of total conversations).

The conversation breakdown chart shows the breakdown of all dispositions for the conversations. On hover, campaigns with the highest traffic show the number of conversations received on the tracking numbers for the campaign.

The top referring sites chart shows the data for the websites with the highest traffic, and the funnel of conversation chart shows the data for the Number of all visitors and the Number of phone calls. These charts are only available to users that utilize DNI (Dynamic number insertion)
